\n
## Line Chart: Performance vs. Training Tokens
### Overview
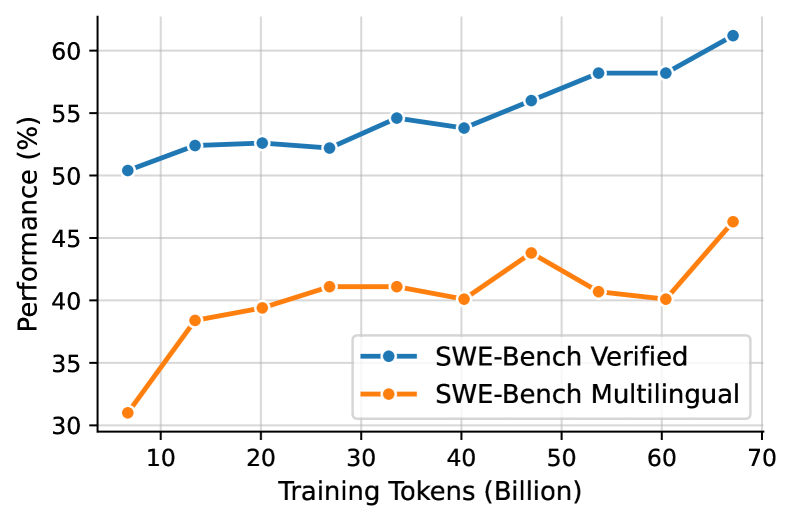
This line chart depicts the performance of two models, "SWE-Bench Verified" and "SWE-Bench Multilingual", as a function of training tokens. The x-axis represents the number of training tokens in billions, and the y-axis represents performance as a percentage. The chart shows how performance changes as the models are trained with increasing amounts of data.
### Components/Axes
* **X-axis Title:** "Training Tokens (Billion)"
* **Y-axis Title:** "Performance (%)"
* **X-axis Markers:** 10, 20, 30, 40, 50, 60, 70
* **Y-axis Markers:** 30, 35, 40, 45, 50, 55, 60
* **Legend:** Located in the bottom-right corner.
* "SWE-Bench Verified" - Blue line with circle markers.
* "SWE-Bench Multilingual" - Orange line with circle markers.
### Detailed Analysis
**SWE-Bench Verified (Blue Line):**
The blue line representing "SWE-Bench Verified" generally slopes upward, indicating increasing performance with more training tokens.
* At 10 Billion Tokens: Approximately 51% performance.
* At 20 Billion Tokens: Approximately 52.5% performance.
* At 30 Billion Tokens: Approximately 53.5% performance.
* At 40 Billion Tokens: Approximately 55% performance.
* At 50 Billion Tokens: Approximately 56% performance.
* At 60 Billion Tokens: Approximately 57.5% performance.
* At 70 Billion Tokens: Approximately 61% performance.
**SWE-Bench Multilingual (Orange Line):**
The orange line representing "SWE-Bench Multilingual" shows a more fluctuating trend. It initially increases, then decreases, and finally increases again.
* At 10 Billion Tokens: Approximately 31% performance.
* At 20 Billion Tokens: Approximately 40% performance.
* At 30 Billion Tokens: Approximately 41.5% performance.
* At 40 Billion Tokens: Approximately 43% performance.
* At 50 Billion Tokens: Approximately 41% performance.
* At 60 Billion Tokens: Approximately 40% performance.
* At 70 Billion Tokens: Approximately 46% performance.
### Key Observations
* "SWE-Bench Verified" consistently outperforms "SWE-Bench Multilingual" across all training token values.
* The performance of "SWE-Bench Verified" shows a steady increase, with a more significant jump between 60 and 70 billion tokens.
* "SWE-Bench Multilingual" exhibits a peak performance around 40 billion tokens, followed by a slight dip before increasing again at 70 billion tokens.
* The gap between the two models widens as the number of training tokens increases.
### Interpretation
The data suggests that increasing the number of training tokens generally improves the performance of both models. However, "SWE-Bench Verified" benefits more consistently from additional training data than "SWE-Bench Multilingual". The fluctuating performance of "SWE-Bench Multilingual" could indicate that it is more sensitive to the specific composition of the training data or that it may require more sophisticated training techniques to fully leverage larger datasets. The significant performance increase for "SWE-Bench Verified" at 70 billion tokens suggests a potential threshold effect, where a critical mass of data is required to unlock substantial performance gains. The consistent outperformance of "SWE-Bench Verified" implies it is a more robust or better-optimized model for the given task. The difference in performance could be due to architectural differences, training methodologies, or the specific datasets used for training.