## Line Graph: SWE-Bench Model Performance vs. Training Tokens
### Overview
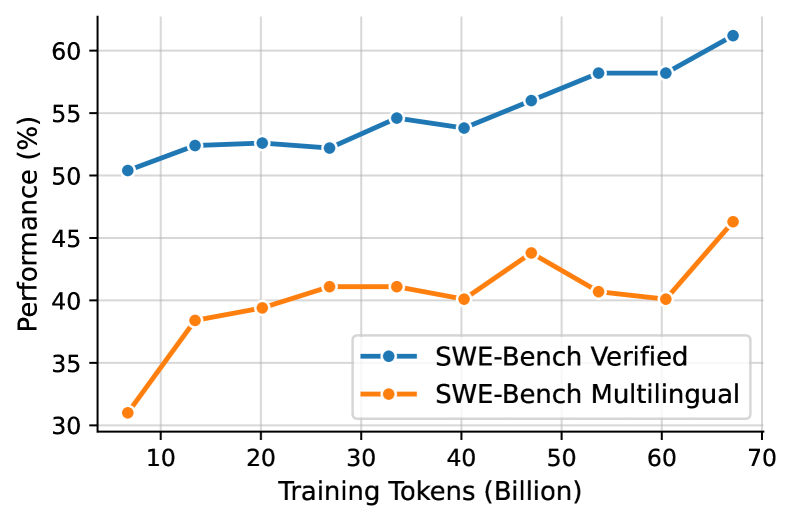
The image depicts a line graph comparing the performance of two SWE-Bench models ("Verified" and "Multilingual") across varying amounts of training tokens (in billions). Performance is measured as a percentage on the y-axis, while training tokens are plotted on the x-axis. The graph spans from 10B to 70B training tokens.
### Components/Axes
- **X-axis**: Training Tokens (Billion) – labeled with increments of 10B (10, 20, 30, ..., 70).
- **Y-axis**: Performance (%) – labeled with increments of 5% (30, 35, 40, ..., 60).
- **Legend**: Located in the bottom-right corner, with two entries:
- **Blue line**: "SWE-Bench Verified"
- **Orange line**: "SWE-Bench Multilingual"
### Detailed Analysis
#### SWE-Bench Verified (Blue Line)
- **Trend**: Steadily increases from ~50% at 10B tokens to ~60% at 70B tokens.
- **Key Data Points**:
- 10B: ~50%
- 20B: ~52%
- 30B: ~52%
- 40B: ~54%
- 50B: ~56%
- 60B: ~58%
- 70B: ~60%
#### SWE-Bench Multilingual (Orange Line)
- **Trend**: Initial sharp rise from 30% at 10B tokens to 45% at 50B tokens, followed by a dip to 40% at 60B tokens, then a recovery to 45% at 70B tokens.
- **Key Data Points**:
- 10B: ~30%
- 20B: ~38%
- 30B: ~41%
- 40B: ~40%
- 50B: ~44%
- 60B: ~40%
- 70B: ~45%
### Key Observations
1. **Performance Gap**: The Verified model consistently outperforms the Multilingual model across all token ranges.
2. **Multilingual Model Volatility**: The Multilingual model shows a peak at 50B tokens (44%) followed by a sharp decline to 40% at 60B tokens, suggesting potential overfitting or instability at higher training scales.
3. **Scalability**: The Verified model demonstrates linear improvement with increased training tokens, while the Multilingual model’s gains plateau or regress.
### Interpretation
The data suggests that the **SWE-Bench Verified** model benefits significantly from additional training data, achieving near-linear performance gains. In contrast, the **SWE-Bench Multilingual** model exhibits diminishing returns and instability at higher token counts, possibly due to challenges in handling multilingual data diversity or overfitting to specific language subsets. The Multilingual model’s dip at 60B tokens may indicate architectural limitations or data quality issues when scaled beyond a certain threshold. These findings highlight the importance of model verification and targeted training strategies for multilingual applications.