# Technical Document Analysis: ArXiv Scatter Plot
## 1. **Chart Identification**
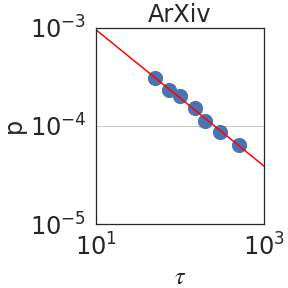
- **Type**: Log-log scatter plot with trend line.
- **Title**: "ArXiv" (centered at the top of the plot).
## 2. **Axis Labels and Markers**
- **X-axis (τ)**:
- Label: "τ" (Greek letter tau).
- Scale: Logarithmic (base 10).
- Range: \(10^1\) to \(10^3\).
- Tick markers: \(10^1\), \(10^2\), \(10^3\).
- **Y-axis (ρ)**:
- Label: "ρ" (Greek letter rho).
- Scale: Logarithmic (base 10).
- Range: \(10^{-5}\) to \(10^{-3}\).
- Tick markers: \(10^{-5}\), \(10^{-4}\), \(10^{-3}\).
## 3. **Key Visual Components**
- **Data Points**:
- Represented as **blue circles**.
- Positioned along the plot, closely aligned with the red trend line.
- Example approximate coordinates (log-scale):
- \((10^1, 10^{-3})\), \((10^2, 10^{-4})\), \((10^3, 10^{-5})\).
- **Trend Line**:
- **Color**: Red.
- **Equation**: Implied power-law relationship (\(y = kx^n\)) due to straight-line alignment on log-log scale.
- Slope: Negative (decreasing trend).
- **Reference Line**:
- **Color**: Dashed gray.
- **Position**: Horizontal line at \(ρ = 10^{-4}\).
## 4. **Trend Verification**
- **Red Line**: Slopes downward from left to right, indicating an inverse relationship between \(τ\) and \(ρ\).
- **Data Points**: Follow the red line closely, confirming the power-law trend.
- **Reference Line**: Acts as a threshold at \(ρ = 10^{-4}\), with data points distributed above and below it.
## 5. **Legend and Color Consistency**
- **Legend**: Not explicitly present in the image.
- **Color Mapping**:
- Blue circles: Data points.
- Red line: Trend line.
- Dashed gray line: Reference threshold.
## 6. **Spatial Grounding**
- **Legend Placement**: Not applicable (no legend).
- **Data Point Colors**: Blue circles match the implied legend (if one existed).
## 7. **Component Isolation**
- **Header**: Title "ArXiv".
- **Main Chart**:
- Axes with logarithmic scales.
- Data points, trend line, and reference line.
- **Footer**: No additional text or components.
## 8. **Textual Transcription**
- **Axis Titles**: "τ" (x-axis), "ρ" (y-axis).
- **Tick Labels**: \(10^1\), \(10^2\), \(10^3\) (x-axis); \(10^{-5}\), \(10^{-4}\), \(10^{-3}\) (y-axis).
- **Reference Line**: \(ρ = 10^{-4}\) (dashed gray).
## 9. **Additional Notes**
- **Language**: All text is in English.
- **No Data Table**: The plot does not include a tabular data structure.
- **Critical Observation**: The log-log scale emphasizes multiplicative relationships, with the red line suggesting a proportional decrease in \(ρ\) as \(τ\) increases.
## 10. **Conclusion**
The plot illustrates a power-law relationship between \(τ\) and \(ρ\), with data points tightly clustered around the red trend line. The reference line at \(ρ = 10^{-4}\) provides a benchmark for comparison.