## Line Graph: EGA Trends Across Environment Steps
### Overview
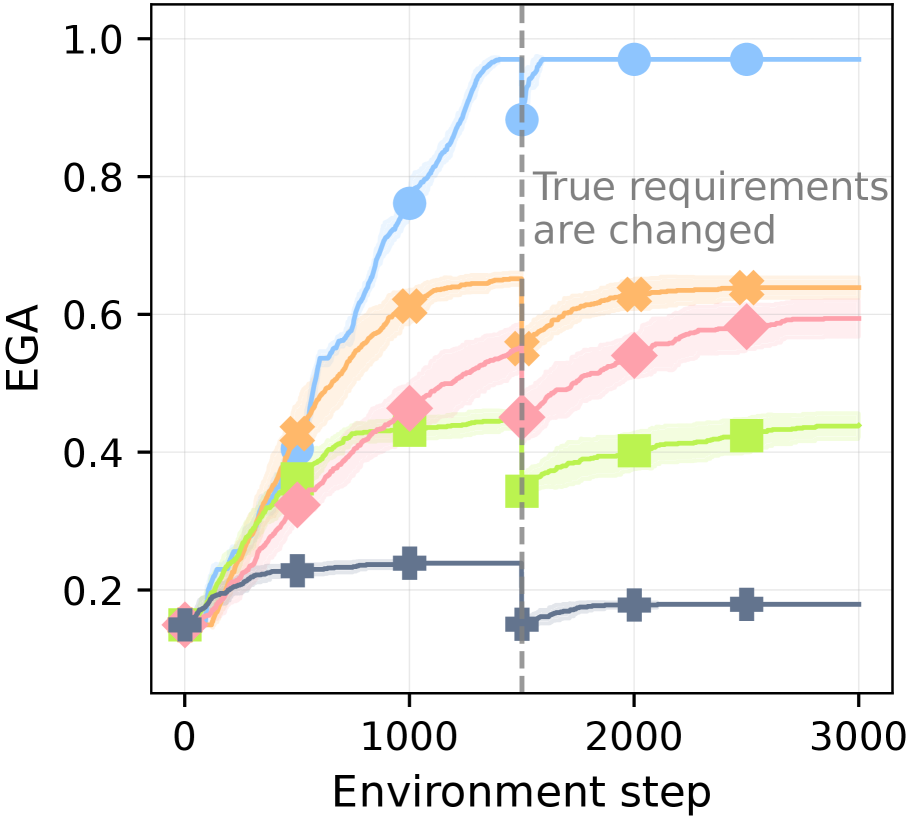
The image depicts a line graph tracking four distinct data series labeled "EGA" (Environmental Growth Adaptation) across incremental "Environment steps" (0–3000). A vertical dashed line at 1500 marks a noted change in "True requirements." Each series is represented by a unique color and marker, with shaded regions indicating uncertainty or confidence intervals.
### Components/Axes
- **X-axis**: "Environment step" (0–3000), linear scale.
- **Y-axis**: "EGA" (0.0–1.0), linear scale.
- **Legend**: Located on the right, associating:
- Blue circles: "Series A"
- Orange crosses: "Series B"
- Pink diamonds: "Series C"
- Green squares: "Series D"
- **Annotations**: Text "True requirements are changed" near the dashed line at 1500.
### Detailed Analysis
1. **Series A (Blue Circles)**:
- Starts at ~0.15 EGA at step 0.
- Sharp upward trend to ~0.75 at step 1000.
- Plateaus at ~0.95 after step 1500, with minor fluctuations.
- Final value at step 3000: ~0.95.
2. **Series B (Orange Crosses)**:
- Begins at ~0.15 EGA at step 0.
- Gradual increase to ~0.65 at step 1500.
- Slows to ~0.68 by step 3000.
3. **Series C (Pink Diamonds)**:
- Starts at ~0.15 EGA at step 0.
- Steady rise to ~0.55 at step 2000.
- Final value at step 3000: ~0.58.
4. **Series D (Green Squares)**:
- Begins at ~0.15 EGA at step 0.
- Slow increase to ~0.45 at step 2000.
- Final value at step 3000: ~0.47.
**Key Observations**:
- All series start at similar EGA values (~0.15) but diverge significantly post-step 1500.
- Series A exhibits the most dramatic change, with a sharp rise and plateau.
- Series B and C show moderate growth, while Series D remains the most stable.
- The vertical dashed line at 1500 correlates with a notable inflection point for Series A and B.
### Interpretation
The graph suggests that environmental steps influence EGA differently across series, with Series A responding most aggressively to the requirement change at step 1500. The shaded regions imply uncertainty in EGA estimates, possibly due to measurement variability or model confidence. The plateau in Series A after step 1500 may indicate saturation or stabilization of adaptation mechanisms. Series D’s gradual growth could reflect slower adaptation or lower sensitivity to environmental changes. The "True requirements are changed" annotation implies a systemic shift (e.g., policy, resource allocation) that disproportionately impacts certain series.