## Line Chart: AUROC vs. Number of Generations
### Overview
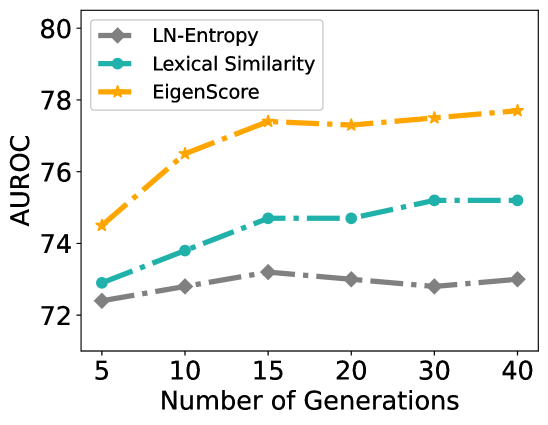
The image is a line chart comparing the performance of three different methods (LN-Entropy, Lexical Similarity, and EigenScore) based on their AUROC (Area Under the Receiver Operating Characteristic curve) scores across varying numbers of generations. The x-axis represents the number of generations, and the y-axis represents the AUROC score.
### Components/Axes
* **Title:** There is no explicit title on the chart.
* **X-axis:**
* Label: "Number of Generations"
* Scale: 5, 10, 15, 20, 30, 40
* **Y-axis:**
* Label: "AUROC"
* Scale: 72, 74, 76, 78, 80
* **Legend:** Located in the top-left corner.
* LN-Entropy (Gray line with diamond markers)
* Lexical Similarity (Teal line with circle markers)
* EigenScore (Orange line with star markers)
### Detailed Analysis
* **LN-Entropy (Gray):** The line starts at approximately 72.4 AUROC at 5 generations. It increases slightly to around 72.8 at 15 generations, then decreases slightly to approximately 72.7 at 30 generations, and ends at approximately 73.0 at 40 generations. Overall, the trend is relatively flat with a slight increase.
* (5, 72.4)
* (10, 72.7)
* (15, 73.2)
* (20, 73.0)
* (30, 72.8)
* (40, 73.0)
* **Lexical Similarity (Teal):** The line starts at approximately 73.0 AUROC at 5 generations. It increases to approximately 73.9 at 10 generations, then to approximately 74.6 at 15 generations, then to approximately 74.7 at 20 generations, then to approximately 75.0 at 30 generations, and ends at approximately 75.2 at 40 generations. Overall, the trend is increasing.
* (5, 73.0)
* (10, 73.9)
* (15, 74.6)
* (20, 74.7)
* (30, 75.0)
* (40, 75.2)
* **EigenScore (Orange):** The line starts at approximately 74.5 AUROC at 5 generations. It increases sharply to approximately 76.4 at 10 generations, then to approximately 77.3 at 15 generations, then to approximately 77.3 at 20 generations, then to approximately 77.6 at 30 generations, and ends at approximately 77.8 at 40 generations. The trend shows a rapid initial increase, followed by a plateau.
* (5, 74.5)
* (10, 76.4)
* (15, 77.3)
* (20, 77.3)
* (30, 77.6)
* (40, 77.8)
### Key Observations
* EigenScore consistently outperforms Lexical Similarity and LN-Entropy across all numbers of generations.
* LN-Entropy shows the least improvement with increasing generations.
* EigenScore shows a significant initial increase in AUROC, but the improvement plateaus after 15 generations.
* Lexical Similarity shows a steady increase in AUROC with increasing generations.
### Interpretation
The chart suggests that EigenScore is the most effective method among the three for this particular task, as it consistently achieves the highest AUROC scores. While Lexical Similarity shows a steady improvement with more generations, LN-Entropy's performance remains relatively stable and lower than the other two. The plateauing of EigenScore's performance after 15 generations indicates that increasing the number of generations beyond this point may not yield significant improvements in AUROC. The data implies that the relationship between the number of generations and AUROC is not linear and varies depending on the method used.