## Chart Type: Line Graph of AUROC vs. Number of Generations
### Overview
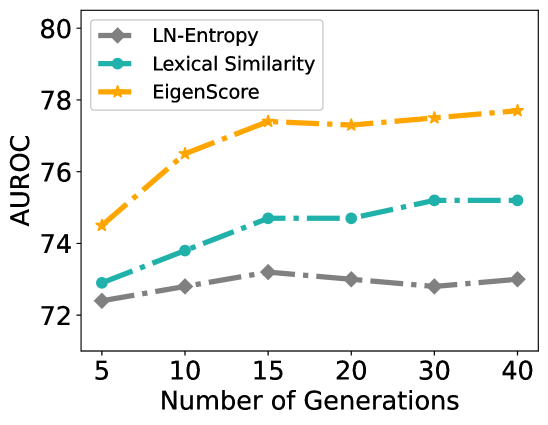
This image is a line graph comparing the performance of three different methods—**LN-Entropy**, **Lexical Similarity**, and **EigenScore**—measured by **AUROC** (Area Under the Receiver Operating Characteristic curve) across a varying **Number of Generations**. The graph shows how performance scales as more generations are sampled.
### Components/Axes
* **X-axis (Horizontal)**: Labeled "**Number of Generations**". It features discrete markers at **5, 10, 15, 20, 30, and 40**. Note that the spacing between 20, 30, and 40 is visually compressed compared to the 5-unit increments at the start.
* **Y-axis (Vertical)**: Labeled "**AUROC**". The scale ranges from **72 to 80**, with major tick marks every **2 units** (72, 74, 76, 78, 80).
* **Legend**: Located in the **top-left** of the chart area.
* **Grey line with diamond markers**: LN-Entropy
* **Teal (blue-green) line with circle markers**: Lexical Similarity
* **Orange line with star markers**: EigenScore
* **Line Style**: All three series use a **dash-dot** line pattern.
### Detailed Analysis
The following table provides approximate AUROC values extracted from the visual data points.
| Number of Generations | LN-Entropy (Grey Diamond) | Lexical Similarity (Teal Circle) | EigenScore (Orange Star) |
| :--- | :--- | :--- | :--- |
| **5** | ~72.4 ± 0.1 | ~72.9 ± 0.1 | ~74.5 ± 0.1 |
| **10** | ~72.8 ± 0.1 | ~73.8 ± 0.1 | ~76.5 ± 0.1 |
| **15** | ~73.2 ± 0.1 | ~74.7 ± 0.1 | ~77.4 ± 0.1 |
| **20** | ~73.0 ± 0.1 | ~74.7 ± 0.1 | ~77.3 ± 0.1 |
| **30** | ~72.8 ± 0.1 | ~75.2 ± 0.1 | ~77.5 ± 0.1 |
| **40** | ~73.0 ± 0.1 | ~75.2 ± 0.1 | ~77.7 ± 0.1 |
#### Trend Verification:
* **EigenScore (Orange)**: Slopes upward sharply from 5 to 15 generations, then enters a plateau phase with a very slight positive trend toward 40. It maintains the highest position throughout.
* **Lexical Similarity (Teal)**: Slopes upward steadily from 5 to 15, plateaus between 15 and 20, rises slightly to 30, and then levels off. It consistently holds the middle position.
* **LN-Entropy (Grey)**: Shows a slight upward slope from 5 to 15, followed by a minor dip and relative stability around the 73.0 mark. It is the lowest-performing metric shown.
### Key Observations
* **Dominance of EigenScore**: The EigenScore method consistently achieves the highest AUROC across all tested generation counts, starting roughly 2 points higher than the others at 5 generations and ending about 2.5 to 4.7 points higher at 40 generations.
* **Diminishing Returns**: For all three methods, the most significant performance gains occur between **5 and 15 generations**. Beyond 15 generations, the curves flatten significantly, suggesting that increasing the number of generations further yields marginal improvements in AUROC.
* **Stability**: LN-Entropy appears to be the most "stable" or least sensitive to the number of generations after the initial increase, fluctuating within a very narrow band (~0.4 AUROC points) between 10 and 40 generations.
### Interpretation
The data suggests that **EigenScore** is a superior metric for the task being measured (likely uncertainty estimation or hallucination detection in LLMs, given the "Generations" and "AUROC" context) compared to Lexical Similarity and LN-Entropy.
The sharp rise in performance up to 15 generations indicates that these methods benefit from having a small pool of diverse outputs to analyze. However, the plateauing effect after 15 generations implies a computational trade-off: generating more than 15-20 samples provides very little additional predictive power for the AUROC score. In a production environment, 15 generations might be identified as the "sweet spot" for balancing accuracy and computational cost.
The fact that EigenScore (likely a graph-based or semantic-clustering approach) outperforms Lexical Similarity (likely based on n-gram overlap or ROUGE-like metrics) suggests that capturing the underlying semantic structure of the generations is more effective than simple word-level comparisons.