## Line Chart: AUROC vs. Number of Generations
### Overview
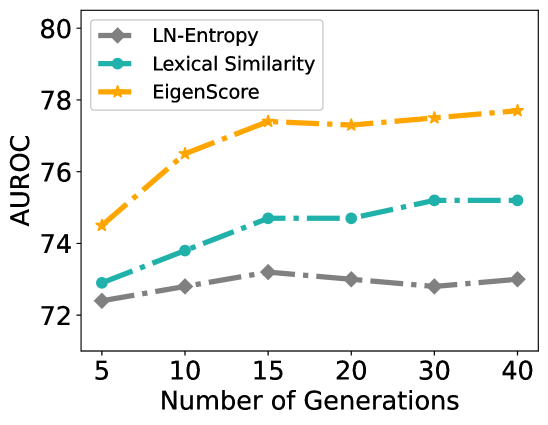
This line chart displays the Area Under the Receiver Operating Characteristic curve (AUROC) as a function of the number of generations. Three different metrics – LN-Entropy, Lexical Similarity, and EigenScore – are compared. The chart shows how the performance of each metric changes as the number of generations increases.
### Components/Axes
* **X-axis:** Number of Generations, ranging from 5 to 40, with markers at 5, 10, 15, 20, 30, and 40.
* **Y-axis:** AUROC, ranging from 70 to 80, with markers at 72, 74, 76, 78.
* **Legend:** Located at the top-left corner of the chart.
* LN-Entropy (Grey line with diamond markers)
* Lexical Similarity (Teal line with circle markers)
* EigenScore (Orange line with star markers)
### Detailed Analysis
* **LN-Entropy:** The grey line with diamond markers shows a slight initial increase from 5 to 10 generations, then plateaus and slightly decreases.
* At 5 Generations: AUROC ≈ 72.4
* At 10 Generations: AUROC ≈ 72.8
* At 15 Generations: AUROC ≈ 72.6
* At 20 Generations: AUROC ≈ 72.4
* At 30 Generations: AUROC ≈ 72.3
* At 40 Generations: AUROC ≈ 72.2
* **Lexical Similarity:** The teal line with circle markers shows a consistent upward trend, but the rate of increase slows down as the number of generations increases.
* At 5 Generations: AUROC ≈ 73.2
* At 10 Generations: AUROC ≈ 74.0
* At 15 Generations: AUROC ≈ 74.7
* At 20 Generations: AUROC ≈ 75.1
* At 30 Generations: AUROC ≈ 75.4
* At 40 Generations: AUROC ≈ 75.5
* **EigenScore:** The orange line with star markers shows a rapid increase from 5 to 15 generations, then levels off, with a slight decrease at 40 generations.
* At 5 Generations: AUROC ≈ 74.5
* At 10 Generations: AUROC ≈ 76.2
* At 15 Generations: AUROC ≈ 77.2
* At 20 Generations: AUROC ≈ 77.4
* At 30 Generations: AUROC ≈ 77.3
* At 40 Generations: AUROC ≈ 77.2
### Key Observations
* EigenScore consistently outperforms both LN-Entropy and Lexical Similarity across all generations.
* LN-Entropy shows minimal change in AUROC as the number of generations increases, suggesting it is less sensitive to the generation process.
* Lexical Similarity shows a steady improvement, but its performance is significantly lower than EigenScore.
* The rate of improvement for EigenScore diminishes after 15 generations.
### Interpretation
The data suggests that EigenScore is the most effective metric for evaluating the quality of generated content, as it consistently achieves the highest AUROC values. The diminishing returns observed after 15 generations indicate that further increasing the number of generations may not significantly improve performance when using EigenScore. LN-Entropy appears to be a relatively stable metric, but its low AUROC values suggest it may not be sensitive enough to capture meaningful differences in generated content. Lexical Similarity shows some improvement with increasing generations, but it remains significantly lower than EigenScore. This could indicate that EigenScore captures more complex aspects of content quality than simple lexical similarity. The plateauing of all curves suggests a point of diminishing returns in the generation process, where further iterations yield minimal improvements in performance as measured by these metrics.