## Line Chart: AUROC Performance Across Generations
### Overview
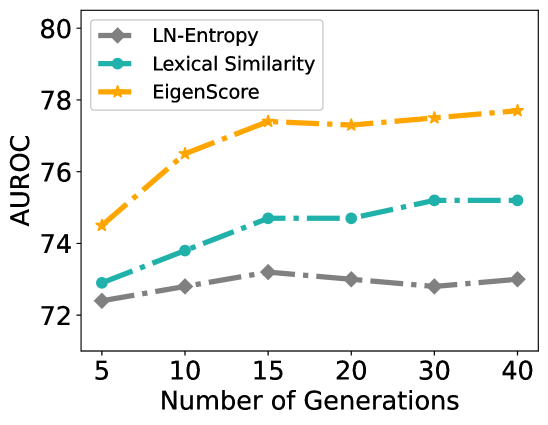
The image displays a line chart comparing the performance of three different methods—LN-Entropy, Lexical Similarity, and EigenScore—measured by AUROC (Area Under the Receiver Operating Characteristic curve) as a function of the "Number of Generations." The chart illustrates how each method's performance evolves as the number of generations increases from 5 to 40.
### Components/Axes
* **Y-Axis (Vertical):** Labeled "AUROC". The scale ranges from 72 to 80, with major tick marks at intervals of 2 (72, 74, 76, 78, 80).
* **X-Axis (Horizontal):** Labeled "Number of Generations". The scale shows discrete points at 5, 10, 15, 20, 30, and 40.
* **Legend:** Positioned in the top-left corner of the chart area. It contains three entries:
1. **LN-Entropy:** Represented by a gray line with diamond markers.
2. **Lexical Similarity:** Represented by a teal (blue-green) line with circular markers.
3. **EigenScore:** Represented by an orange line with star markers.
### Detailed Analysis
The chart plots three distinct data series, each showing a different trend:
1. **EigenScore (Orange line, star markers):**
* **Trend:** Shows a clear and consistent upward trend, with the steepest increase occurring between 5 and 15 generations. The growth rate slows but remains positive after 15 generations.
* **Approximate Data Points:**
* 5 generations: ~74.5
* 10 generations: ~76.5
* 15 generations: ~77.5
* 20 generations: ~77.4
* 30 generations: ~77.6
* 40 generations: ~77.8
2. **Lexical Similarity (Teal line, circle markers):**
* **Trend:** Shows a moderate upward trend that appears to plateau after approximately 15 generations. The performance gain from 15 to 40 generations is minimal.
* **Approximate Data Points:**
* 5 generations: ~72.9
* 10 generations: ~73.8
* 15 generations: ~74.7
* 20 generations: ~74.7
* 30 generations: ~75.2
* 40 generations: ~75.2
3. **LN-Entropy (Gray line, diamond markers):**
* **Trend:** Remains relatively flat and stable across all generation counts, showing very little variation. It consistently performs the lowest of the three methods.
* **Approximate Data Points:**
* 5 generations: ~72.4
* 10 generations: ~72.7
* 15 generations: ~73.2
* 20 generations: ~73.0
* 30 generations: ~72.8
* 40 generations: ~73.0
### Key Observations
* **Performance Hierarchy:** EigenScore consistently achieves the highest AUROC across all generation counts, followed by Lexical Similarity, with LN-Entropy performing the worst.
* **Diverging Trends:** The performance gap between EigenScore and the other two methods widens as the number of generations increases. At 5 generations, the spread is about 2.1 AUROC points (74.5 vs. 72.4). By 40 generations, the spread has increased to approximately 4.8 points (77.8 vs. 73.0).
* **Plateau Points:** Lexical Similarity's performance improvement largely plateaus after 15 generations. In contrast, EigenScore continues to show modest gains up to 40 generations.
* **Stability:** LN-Entropy demonstrates high stability but low performance, with its AUROC fluctuating within a narrow band of approximately 0.8 points (72.4 to 73.2).
### Interpretation
The data suggests a significant difference in how these three methods benefit from an increased "Number of Generations."
* **EigenScore** appears to be the most effective and scalable method in this context. Its strong, sustained upward trend indicates that it successfully leverages additional generations to improve its discriminative power (as measured by AUROC). This could imply it is better at refining or exploring a solution space over iterative steps.
* **Lexical Similarity** shows initial benefit from more generations but hits a performance ceiling relatively quickly. This suggests its effectiveness is limited and does not scale well beyond a certain point (around 15 generations in this experiment).
* **LN-Entropy** shows negligible sensitivity to the number of generations. Its flat trend indicates that increasing computational effort (more generations) does not translate to better performance for this metric. It may be measuring a property that is fixed early in the process or is simply less informative for the task at hand.
**Overall Implication:** If the goal is to maximize AUROC with increased generative effort, EigenScore is the superior choice among the methods presented. The chart provides strong visual evidence that its performance advantage becomes more pronounced with greater investment in the number of generations.