## Line Chart: AUROC Performance Across Number of Generations
### Overview
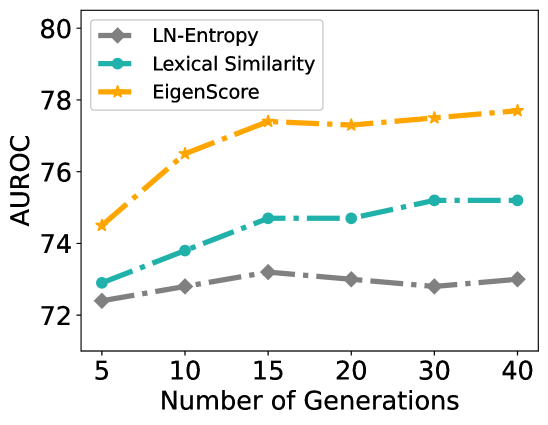
The chart illustrates the performance of three evaluation metrics (LN-Entropy, Lexical Similarity, EigenScore) measured by Area Under the Receiver Operating Characteristic curve (AUROC) across varying numbers of generations (5–40). All metrics show distinct trends, with EigenScore achieving the highest AUROC values throughout.
### Components/Axes
- **X-axis**: "Number of Generations" (discrete markers at 5, 10, 15, 20, 30, 40).
- **Y-axis**: "AUROC" (continuous scale from 72 to 80).
- **Legend**: Located in the top-left corner, mapping:
- Gray diamond: LN-Entropy
- Teal circle: Lexical Similarity
- Orange star: EigenScore
### Detailed Analysis
1. **LN-Entropy (Gray Diamonds)**:
- Starts at ~72.3 at 5 generations.
- Peaks at ~73.1 at 15 generations.
- Declines slightly to ~72.9 at 40 generations.
- Trend: Minor fluctuations with no significant growth.
2. **Lexical Similarity (Teal Circles)**:
- Begins at ~72.8 at 5 generations.
- Rises steadily to ~75.2 at 40 generations.
- Trend: Consistent upward trajectory with minimal plateauing.
3. **EigenScore (Orange Stars)**:
- Starts at ~74.5 at 5 generations.
- Sharp increase to ~77.5 by 15 generations.
- Plateaus between ~77.6–77.8 from 20–40 generations.
- Trend: Rapid initial improvement followed by stabilization.
### Key Observations
- **EigenScore** consistently outperforms other metrics, achieving the highest AUROC values (74.5–77.8).
- **Lexical Similarity** shows the second-best performance, with a steady increase (72.8–75.2).
- **LN-Entropy** remains the lowest-performing metric, with values clustered between 72.3–73.1.
- EigenScore’s sharp rise (5–15 generations) suggests rapid early gains, while Lexical Similarity’s linear growth indicates sustained improvement.
### Interpretation
The data suggests that **EigenScore** is the most effective metric for evaluating performance in this context, particularly in early generations. Its plateau at ~77.8 implies diminishing returns after 15 generations. **Lexical Similarity** demonstrates reliable, incremental gains, making it a viable alternative for long-term evaluation. **LN-Entropy**’s stagnation highlights potential limitations in capturing performance improvements over time. The divergence between EigenScore and Lexical Similarity at later generations (e.g., 30–40) may indicate differing sensitivities to model complexity or data distribution shifts.