# Technical Document Extraction: Control Effect Analysis
## Line Graphs (Left Section)
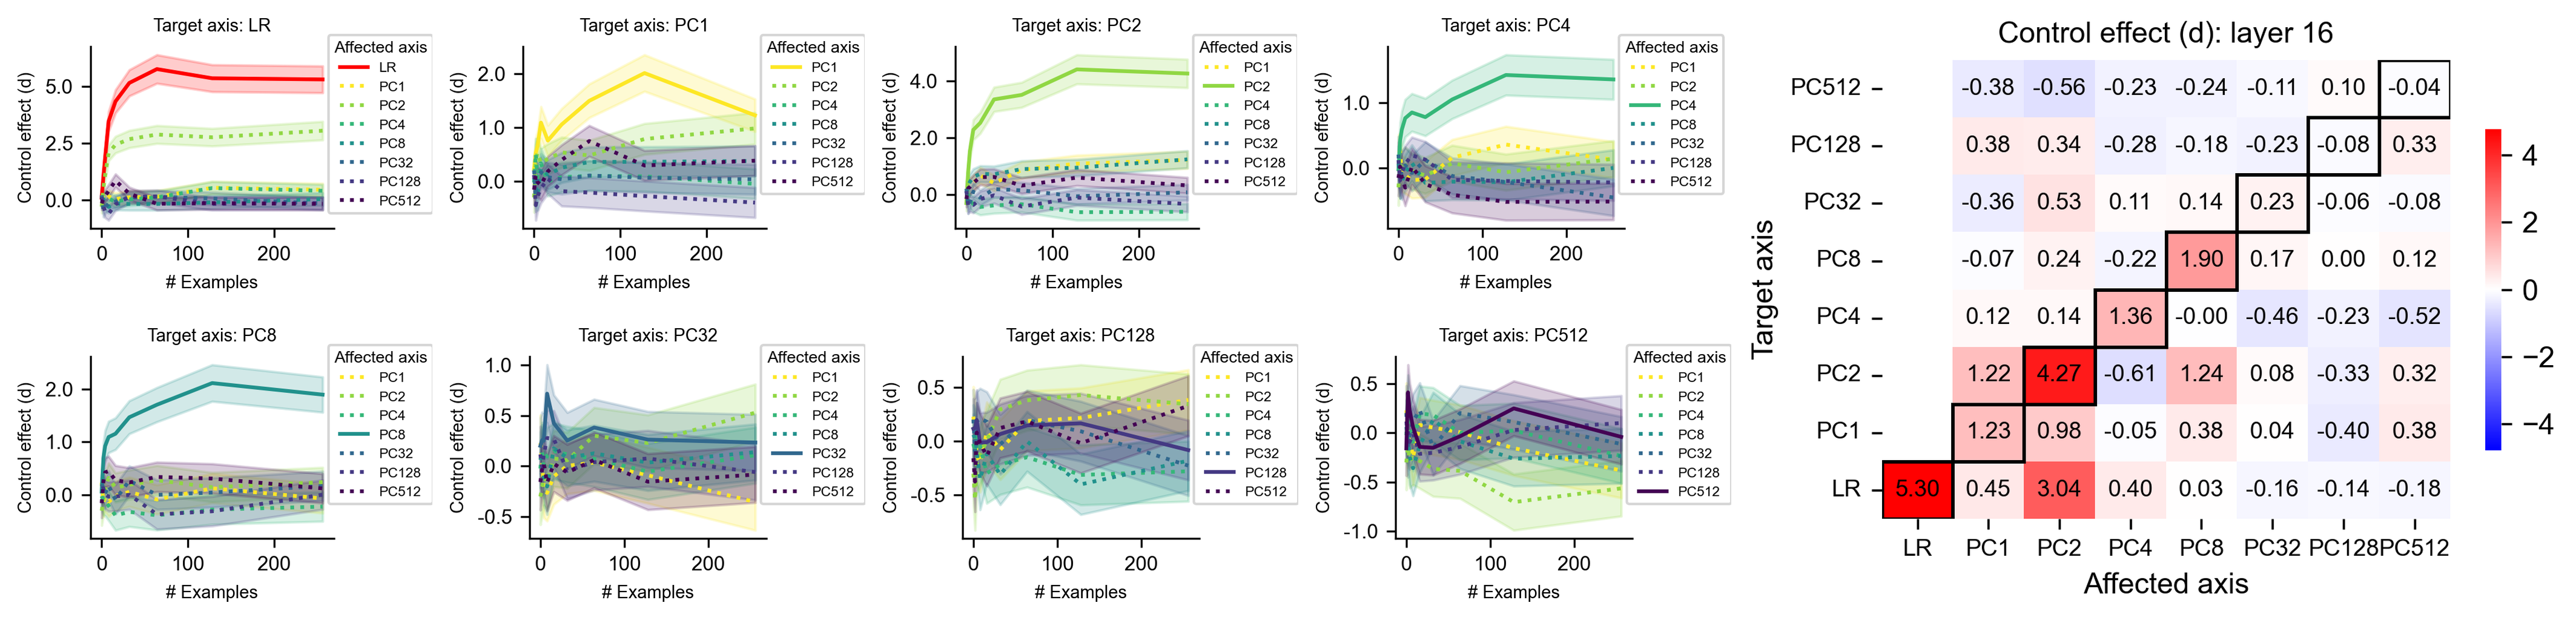
Eight line graphs depict control effect (d) across different target and affected axes. Each graph includes:
- **X-axis**: `# Examples` (0-200)
- **Y-axis**: `Control effect (d)` (range varies by graph)
- **Legend**: Located in top-right corner of each graph, listing affected axes with color coding
### Key Observations:
1. **Legend Color Consistency**:
- Red = LR
- Yellow = PC1
- Green = PC2
- Teal = PC4
- Purple = PC8
- Dark Blue = PC32
- Light Purple = PC128
- Dark Purple = PC512
2. **Graph Trends**:
- **LR Target Axis**: Sharp initial decline (5.0 → 0.0) followed by plateau
- **PC1 Target Axis**: Gradual decline with significant variance (2.0 → 0.0)
- **PC2 Target Axis**: Steep initial rise (0.0 → 4.0) then stabilization
- **PC4 Target Axis**: Moderate increase (0.0 → 1.0) with persistent variability
- **PC8 Target Axis**: Sustained moderate effect (0.0 → 2.0)
- **PC32 Target Axis**: Complex pattern with multiple peaks/troughs
- **PC128 Target Axis**: Gradual increase with high variance
- **PC512 Target Axis**: Stable baseline with minor fluctuations
## Heatmap (Right Section)
Labeled "Control effect (d): layer 16", showing matrix of control effects between target and affected axes.
### Matrix Structure:
- **Rows (Target Axes)**: LR, PC1, PC2, PC4, PC8, PC32, PC128, PC512
- **Columns (Affected Axes)**: PC1, PC2, PC4, PC8, PC32, PC128, PC512
- **Color Scale**: Blue (-4) to Red (+4)
### Key Values:
| Target\Affected | PC1 | PC2 | PC4 | PC8 | PC32 | PC128 | PC512 |
|-----------------|--------|--------|--------|--------|--------|--------|--------|
| **LR** | -0.38 | -0.56 | -0.23 | -0.11 | 0.10 | -0.04 | |
| **PC1** | 0.38 | 0.34 | -0.28 | -0.18 | -0.23 | -0.08 | 0.33 |
| **PC2** | -0.36 | 0.53 | 0.11 | 0.14 | 0.23 | -0.06 | -0.08 |
| **PC4** | -0.07 | 0.24 | -0.22 | 1.90 | 0.17 | 0.00 | 0.12 |
| **PC8** | 1.22 | 4.27 | -0.61 | 1.24 | 0.08 | -0.33 | 0.32 |
| **PC32** | 1.23 | 0.98 | -0.05 | 0.38 | 0.04 | -0.40 | 0.38 |
| **PC128** | 5.30 | 3.04 | 0.40 | 0.03 | -0.16 | -0.14 | -0.18 |
### Notable Patterns:
- **High Positive Effects**:
- PC8→PC2 (4.27)
- LR→PC128 (5.30)
- **Strong Negative Effects**:
- PC1→PC2 (-0.56)
- PC2→PC4 (-0.22)
- **Diagonal Dominance**: Strongest effects along main diagonal (target=affected)
## Spatial Grounding
- **Legend Position**: Top-right corner of each line graph
- **Heatmap Coordinates**:
- Rows: Top to bottom (LR → PC512)
- Columns: Left to right (PC1 → PC512)
## Language Note
All text appears in English. No non-English content detected.