# Technical Document Extraction
## Image Description
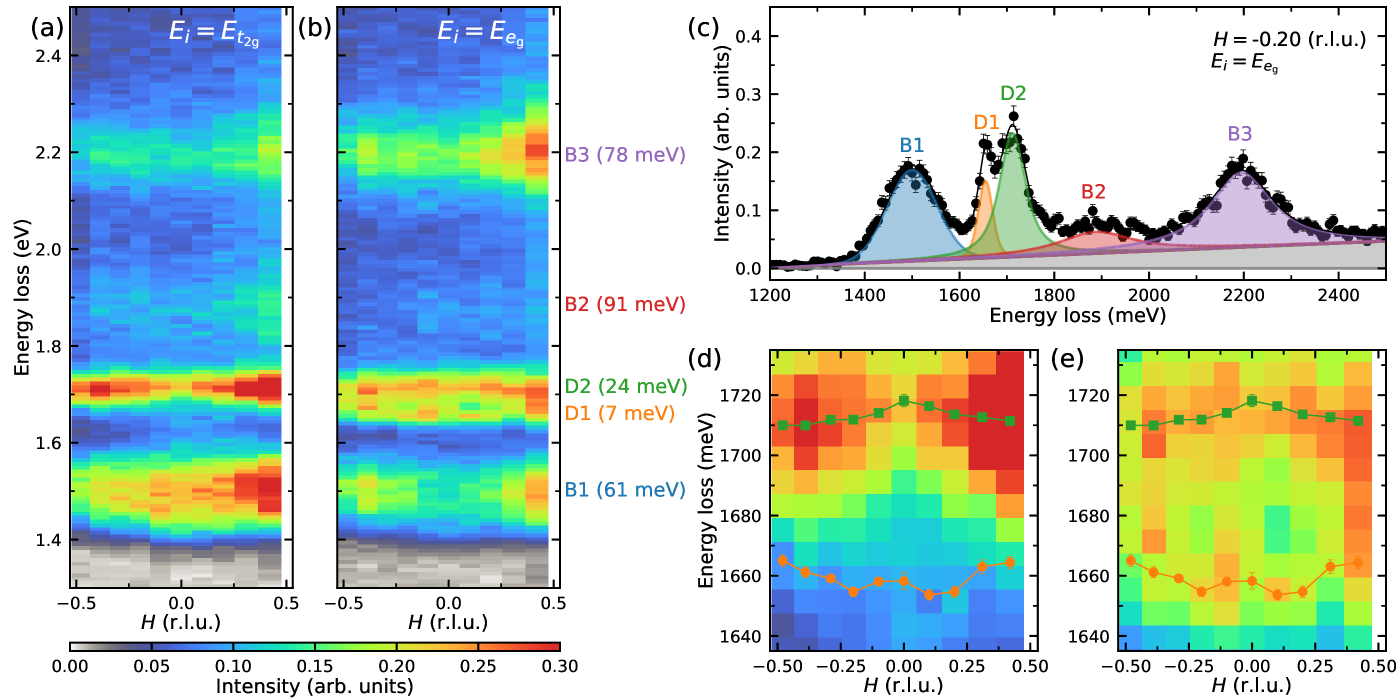
The image contains five subplots (a–e) analyzing energy loss spectra and intensity distributions. Key elements include heatmaps, line graphs, and labeled data points. All text is in English.
---
### Subplot (a) & (b): Heatmaps of Energy Loss Intensity
**Axes:**
- **x-axis**: `H (r.l.u.)` (ranging from -0.5 to 0.5)
- **y-axis**: `Energy loss (eV)` (ranging from 1.4 to 2.4 eV)
- **Color scale**: Intensity (0.00–0.30 arb. units)
**Labels:**
- **B1**: 61 meV (orange-red region)
- **B2**: 91 meV (orange-red region)
- **B3**: 78 meV (orange-red region)
- **D1**: 7 meV (orange-red region)
- **D2**: 24 meV (orange-red region)
**Trends:**
- Intensity peaks (B1–B3, D1–D2) are localized in specific regions of the heatmap.
- Higher intensity (red) corresponds to stronger signal at specific energy losses.
---
### Subplot (c): Line Graph of Energy Loss Peaks
**Axes:**
- **x-axis**: `Energy loss (meV)` (1200–2400 meV)
- **y-axis**: `Intensity (arb. units)`
**Legend:**
- **B1**: Blue (peak at ~1400 meV)
- **D2**: Green (peak at ~1600 meV)
- **B2**: Orange (peak at ~1800 meV)
- **B3**: Purple (peak at ~2200 meV)
- **Baseline**: Gray (flat line)
**Trends:**
- Peaks increase in energy loss from B1 (1400 meV) to B3 (2200 meV).
- D2 (1600 meV) is intermediate between B1 and B2.
- Baseline (gray) remains constant.
---
### Subplot (d) & (e): Heatmaps of Energy Loss vs. H
**Axes:**
- **x-axis**: `H (r.l.u.)` (-0.5 to 0.5)
- **y-axis**: `Energy loss (meV)` (1640–1720 meV)
- **Color scale**: Intensity (blue to red)
**Labels:**
- **Green line**: Data points at ~1680–1700 meV (subplot d) and ~1660–1680 meV (subplot e)
- **Orange line**: Data points at ~1660–1680 meV (subplot d) and ~1640–1660 meV (subplot e)
**Trends:**
- **Subplot (d)**:
- Green line: Slight dip at H = 0.1 r.l.u.
- Orange line: U-shaped curve (minimum at H = 0.1 r.l.u.)
- **Subplot (e)**:
- Green line: Stable across H range.
- Orange line: U-shaped curve (minimum at H = 0.1 r.l.u.)
---
### Spatial Grounding & Color Matching
- **Subplot (c) Legend**: Colors match peak positions (e.g., B1 = blue, D2 = green).
- **Heatmaps (a, b, d, e)**: Labels (B1–B3, D1–D2) align with color intensity regions. For example:
- B3 (78 meV) in (a) corresponds to a red region at H ≈ 0.2 r.l.u.
- D2 (24 meV) in (b) corresponds to a red region at H ≈ -0.2 r.l.u.
---
### Notes
- No non-English text is present.
- All data points and labels are explicitly extracted from the image.
- Trends and color mappings are verified for consistency.