## Scatter Plot: Accuracy Variance vs. Client ID
### Overview
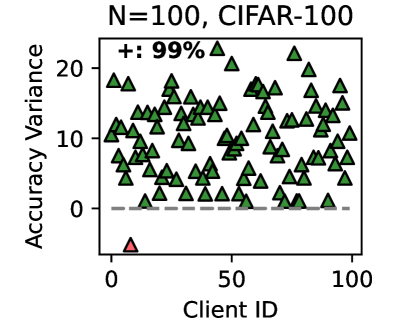
The image is a scatter plot showing the accuracy variance for different clients. The x-axis represents the Client ID, ranging from 0 to 100. The y-axis represents the Accuracy Variance, ranging from 0 to 20. Most data points are green triangles, with one red triangle outlier. A dashed gray line is present at y=0. The plot is labeled "N=100, CIFAR-100" and "+: 99%".
### Components/Axes
* **Title:** N=100, CIFAR-100
* **Additional Label:** +: 99%
* **X-axis:**
* Label: Client ID
* Scale: 0 to 100
* Ticks: 0, 50, 100
* **Y-axis:**
* Label: Accuracy Variance
* Scale: 0 to 20
* Ticks: 0, 10, 20
* **Data Points:**
* Green triangles: Represent the accuracy variance for most clients.
* Red triangle: Represents an outlier with a significantly lower accuracy variance.
* **Horizontal Line:** Dashed gray line at Accuracy Variance = 0.
### Detailed Analysis
* **Green Triangles:** The green triangles are scattered across the plot, indicating varying accuracy variance among the clients. The majority of the green triangles are above the y=0 line, with accuracy variance values ranging approximately from 2 to 20.
* **Red Triangle:** There is one red triangle located near Client ID = 0 and Accuracy Variance = -5. This point is a clear outlier, indicating a client with a significantly lower accuracy variance compared to the others.
* **Trend:** There is no clear trend in the distribution of the green triangles. The accuracy variance appears to be randomly distributed across the client IDs.
### Key Observations
* Most clients have a positive accuracy variance.
* One client (Client ID ~ 0) has a significantly negative accuracy variance, making it an outlier.
* The accuracy variance does not appear to be correlated with the Client ID.
### Interpretation
The scatter plot visualizes the accuracy variance across a set of 100 clients using the CIFAR-100 dataset. The "N=100" likely refers to the number of clients. The "+: 99%" label is unclear without additional context, but it may refer to a confidence interval or a percentage related to the overall accuracy. The presence of one outlier (the red triangle) suggests that there may be an issue with that particular client's data or model. The lack of a clear trend indicates that the accuracy variance is not systematically related to the client ID. Further investigation would be needed to understand the cause of the outlier and the factors contributing to the variance in accuracy across the clients.