\n
## Scatter Plot: Accuracy Variance vs. Client ID
### Overview
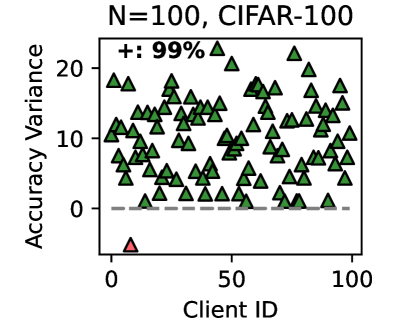
The image presents a scatter plot visualizing the relationship between Client ID and Accuracy Variance. The data points are represented by green triangles. A single red triangle is present at the beginning of the x-axis. A horizontal dashed gray line is present at y=0. The plot is titled with "N=100, CIFAR-100" and "+/- 99%".
### Components/Axes
* **X-axis:** Client ID, ranging from approximately 0 to 100.
* **Y-axis:** Accuracy Variance, ranging from approximately 0 to 22.
* **Title:** N=100, CIFAR-100, +/- 99%
* **Data Points:** Green triangles representing individual client data.
* **Outlier:** A single red triangle at Client ID 0.
* **Horizontal Line:** A dashed gray line at Accuracy Variance = 0.
### Detailed Analysis
The scatter plot shows a generally positive correlation between Client ID and Accuracy Variance, although with significant scatter.
* **Trend:** The data points generally increase in Accuracy Variance as Client ID increases, but there are many fluctuations. The variance appears to be higher for Client IDs between 20 and 80.
* **Data Points (Green Triangles):**
* Client ID 0: Accuracy Variance ~ 10
* Client ID 10: Accuracy Variance ~ 12
* Client ID 20: Accuracy Variance ~ 16
* Client ID 30: Accuracy Variance ~ 18
* Client ID 40: Accuracy Variance ~ 14
* Client ID 50: Accuracy Variance ~ 17
* Client ID 60: Accuracy Variance ~ 15
* Client ID 70: Accuracy Variance ~ 13
* Client ID 80: Accuracy Variance ~ 11
* Client ID 90: Accuracy Variance ~ 9
* Client ID 100: Accuracy Variance ~ 8
* **Outlier (Red Triangle):**
* Client ID 0: Accuracy Variance ~ -2. This point is significantly below the general trend and the horizontal line at 0.
* **Horizontal Line:** The dashed gray line at Accuracy Variance = 0 serves as a baseline for comparison. Most data points are above this line, indicating positive accuracy variance.
### Key Observations
* The majority of clients exhibit positive accuracy variance.
* There is a significant outlier at Client ID 0 with negative accuracy variance.
* The accuracy variance is not consistent across all clients, showing substantial variability.
* The data suggests a slight upward trend in accuracy variance as Client ID increases, but the relationship is not strong.
### Interpretation
The plot likely represents the performance of a machine learning model (trained on CIFAR-100 with N=100 clients) across different clients. Accuracy Variance measures the spread of accuracy scores for each client. The positive variance for most clients suggests that the model's performance varies across different data distributions or conditions associated with each client. The outlier at Client ID 0 indicates a client with significantly lower and potentially negative accuracy variance, which could be due to data quality issues, a unique data distribution, or a problem with the client's setup. The "+/- 99%" likely refers to a confidence interval or a statistical threshold related to the data. The horizontal line at 0 indicates the baseline for variance, and the fact that most points are above it suggests that the model generally performs better than random chance for most clients. The scatter suggests that the model's performance is sensitive to client-specific factors.