## Scatter Plot: N=100, CIFAR-100
### Overview
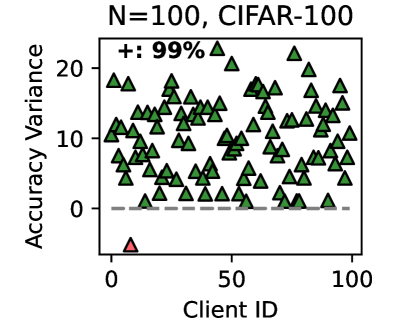
The image is a scatter plot visualizing the relationship between **Client ID** (x-axis) and **Accuracy Variance** (y-axis) for 100 clients. The plot uses green triangles to represent data points, with a single red triangle as an outlier. A dashed horizontal line at y=0 is present, and a legend indicates "+: 99%".
### Components/Axes
- **X-axis (Client ID)**: Ranges from 0 to 100, labeled "Client ID".
- **Y-axis (Accuracy Variance)**: Ranges from 0 to 20, labeled "Accuracy Variance".
- **Legend**: Located in the top-right corner, with a green triangle labeled "+: 99%".
- **Outlier**: A red triangle at (Client ID = 0, Accuracy Variance ≈ 0).
### Detailed Analysis
- **Data Points**:
- **Green Triangles**: Approximately 99% of the data points (as per the legend) are distributed across the plot. Most points cluster between y=0 and y=10, with some variability. A few points reach up to y=20.
- **Red Triangle**: A single outlier at (0, 0), positioned at the bottom-left corner of the plot.
- **Dashed Line**: A horizontal dashed line at y=0 separates the plot, likely indicating a baseline or threshold.
### Key Observations
1. **Outlier**: The red triangle at (0, 0) is the only data point with 0 accuracy variance, suggesting a significant deviation from the majority.
2. **Distribution**: Most clients (99%) exhibit accuracy variance between 0 and 20, with no clear upward or downward trend.
3. **Clustering**: Data points are densely packed in the lower half of the plot (y=0–10), with sparse points in the upper half (y=10–20).
### Interpretation
- **Data Trends**: The majority of clients show moderate accuracy variance, indicating relatively consistent performance. The outlier (Client ID 0) may represent a unique case, such as a client with no data, a failed model, or an error in data collection.
- **Legend Context**: The "+: 99%" label suggests that 99% of the data points meet a specific criterion (e.g., non-zero variance), but the exact threshold is not explicitly defined in the plot.
- **Anomalies**: The red triangle’s position at (0, 0) raises questions about its validity. It could indicate a missing or corrupted dataset for Client ID 0, or a deliberate exclusion from the 99% majority.
This plot highlights the variability in model performance across clients, with a critical outlier requiring further investigation.