## Line Chart: Efficiency vs. Node Size
### Overview
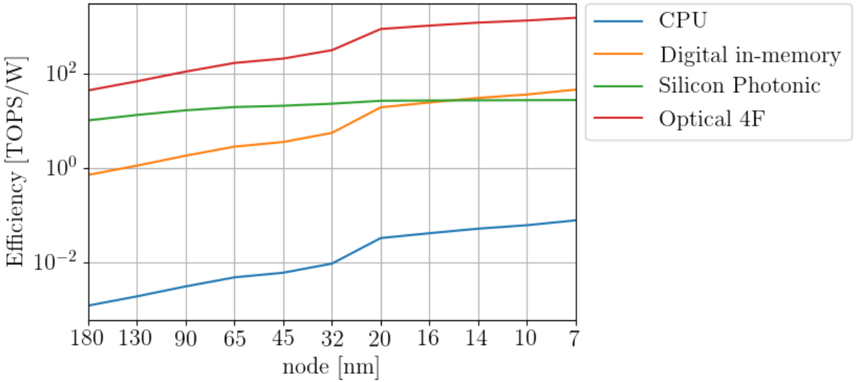
The image is a line chart comparing the efficiency (TOPS/W) of four different computing architectures (CPU, Digital in-memory, Silicon Photonic, and Optical 4F) across various node sizes (nm). The y-axis represents efficiency on a logarithmic scale, while the x-axis represents the node size in nanometers.
### Components/Axes
* **Title:** There is no explicit title on the chart.
* **X-axis:**
* Label: "node [nm]"
* Scale: Linear, with values at 180, 130, 90, 65, 45, 32, 20, 16, 14, 10, and 7.
* **Y-axis:**
* Label: "Efficiency [TOPS/W]"
* Scale: Logarithmic, with values at 10<sup>-2</sup>, 10<sup>0</sup>, and 10<sup>2</sup>.
* **Legend:** Located on the top-right of the chart.
* CPU (Blue)
* Digital in-memory (Orange)
* Silicon Photonic (Green)
* Optical 4F (Red)
### Detailed Analysis
* **CPU (Blue):** The efficiency of the CPU architecture increases as the node size decreases.
* At 180 nm, the efficiency is approximately 0.003 TOPS/W.
* At 7 nm, the efficiency is approximately 0.03 TOPS/W.
* **Digital in-memory (Orange):** The efficiency of the Digital in-memory architecture increases as the node size decreases.
* At 180 nm, the efficiency is approximately 0.5 TOPS/W.
* At 7 nm, the efficiency is approximately 10 TOPS/W.
* **Silicon Photonic (Green):** The efficiency of the Silicon Photonic architecture increases slightly as the node size decreases, then plateaus.
* At 180 nm, the efficiency is approximately 5 TOPS/W.
* At 7 nm, the efficiency is approximately 50 TOPS/W.
* **Optical 4F (Red):** The efficiency of the Optical 4F architecture increases as the node size decreases.
* At 180 nm, the efficiency is approximately 50 TOPS/W.
* At 7 nm, the efficiency is approximately 200 TOPS/W.
### Key Observations
* Optical 4F consistently demonstrates the highest efficiency across all node sizes.
* CPU consistently demonstrates the lowest efficiency across all node sizes.
* The efficiency of all architectures generally increases as the node size decreases.
* The rate of increase in efficiency varies among the different architectures.
### Interpretation
The chart illustrates the relationship between node size and efficiency for different computing architectures. The data suggests that smaller node sizes generally lead to higher efficiency, which is consistent with the trend of miniaturization in the semiconductor industry. The Optical 4F architecture appears to be the most efficient, while the CPU architecture is the least efficient among those compared. The Silicon Photonic architecture shows a plateau in efficiency at smaller node sizes, suggesting a potential limitation in its scalability compared to Optical 4F. The Digital in-memory architecture shows a significant increase in efficiency as node size decreases, indicating its potential for future development.