## Line Chart: Efficiency vs. Node Size for Different Computing Architectures
### Overview
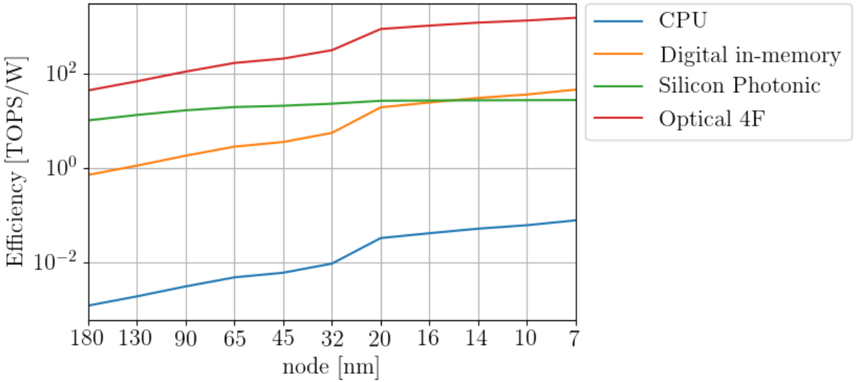
This chart depicts the efficiency (measured in TOPS/W) of four different computing architectures – CPU, Digital in-memory, Silicon Photonic, and Optical 4F – as a function of node size (measured in nanometers). The chart uses a logarithmic scale for the y-axis (Efficiency) to better visualize the differences in efficiency across the architectures.
### Components/Axes
* **X-axis:** Node [nm] - Ranges from 7nm to 180nm. The axis is linear.
* **Y-axis:** Efficiency [TOPS/W] - Ranges from approximately 0.01 to 150 TOPS/W. The axis is logarithmic (base 10).
* **Data Series:**
* CPU (Blue Line)
* Digital in-memory (Orange Line)
* Silicon Photonic (Green Line)
* Optical 4F (Red Line)
* **Legend:** Located in the top-right corner of the chart. It maps colors to the corresponding computing architecture.
### Detailed Analysis
The chart shows the efficiency trends of each architecture as the node size decreases.
* **CPU (Blue Line):** The line slopes upward, indicating increasing efficiency as the node size decreases.
* At 180nm: Approximately 0.02 TOPS/W
* At 130nm: Approximately 0.03 TOPS/W
* At 90nm: Approximately 0.05 TOPS/W
* At 65nm: Approximately 0.08 TOPS/W
* At 45nm: Approximately 0.15 TOPS/W
* At 32nm: Approximately 0.3 TOPS/W
* At 20nm: Approximately 0.5 TOPS/W
* At 16nm: Approximately 0.7 TOPS/W
* At 10nm: Approximately 1.0 TOPS/W
* At 7nm: Approximately 1.3 TOPS/W
* **Digital in-memory (Orange Line):** The line initially slopes upward, then plateaus.
* At 180nm: Approximately 10 TOPS/W
* At 130nm: Approximately 20 TOPS/W
* At 90nm: Approximately 30 TOPS/W
* At 65nm: Approximately 50 TOPS/W
* At 45nm: Approximately 80 TOPS/W
* At 32nm: Approximately 120 TOPS/W
* At 20nm: Approximately 130 TOPS/W
* At 16nm: Approximately 130 TOPS/W
* At 10nm: Approximately 130 TOPS/W
* At 7nm: Approximately 130 TOPS/W
* **Silicon Photonic (Green Line):** The line slopes upward, but less steeply than Digital in-memory.
* At 180nm: Approximately 10 TOPS/W
* At 130nm: Approximately 15 TOPS/W
* At 90nm: Approximately 20 TOPS/W
* At 65nm: Approximately 30 TOPS/W
* At 45nm: Approximately 45 TOPS/W
* At 32nm: Approximately 60 TOPS/W
* At 20nm: Approximately 70 TOPS/W
* At 16nm: Approximately 75 TOPS/W
* At 10nm: Approximately 80 TOPS/W
* At 7nm: Approximately 85 TOPS/W
* **Optical 4F (Red Line):** The line slopes upward, showing the highest efficiency overall.
* At 180nm: Approximately 80 TOPS/W
* At 130nm: Approximately 90 TOPS/W
* At 90nm: Approximately 100 TOPS/W
* At 65nm: Approximately 110 TOPS/W
* At 45nm: Approximately 120 TOPS/W
* At 32nm: Approximately 130 TOPS/W
* At 20nm: Approximately 140 TOPS/W
* At 16nm: Approximately 145 TOPS/W
* At 10nm: Approximately 148 TOPS/W
* At 7nm: Approximately 150 TOPS/W
### Key Observations
* Optical 4F consistently exhibits the highest efficiency across all node sizes.
* Digital in-memory shows a significant initial efficiency gain as node size decreases, but then plateaus.
* CPU has the lowest efficiency and the smallest efficiency gain with decreasing node size.
* The logarithmic scale on the y-axis emphasizes the large differences in efficiency between the architectures.
### Interpretation
The data suggests that as technology scales down (smaller node sizes), the efficiency of computing architectures generally increases. However, the rate of improvement varies significantly. Optical 4F appears to be the most promising architecture in terms of efficiency, maintaining a substantial lead over the other architectures. Digital in-memory shows strong initial gains but reaches a limit, indicating that further scaling may not yield significant efficiency improvements. The CPU exhibits the least improvement, suggesting that traditional CPU architectures may struggle to keep pace with more advanced architectures in terms of efficiency as technology scales. The plateauing of Digital in-memory efficiency could be due to fundamental limitations in the architecture itself, or due to the challenges of further optimizing the design at smaller node sizes. The consistent upward trend of Optical 4F suggests that this architecture is well-suited for continued scaling and offers the potential for even greater efficiency gains in the future.