## Bar Chart: Model Logical Consistency
### Overview
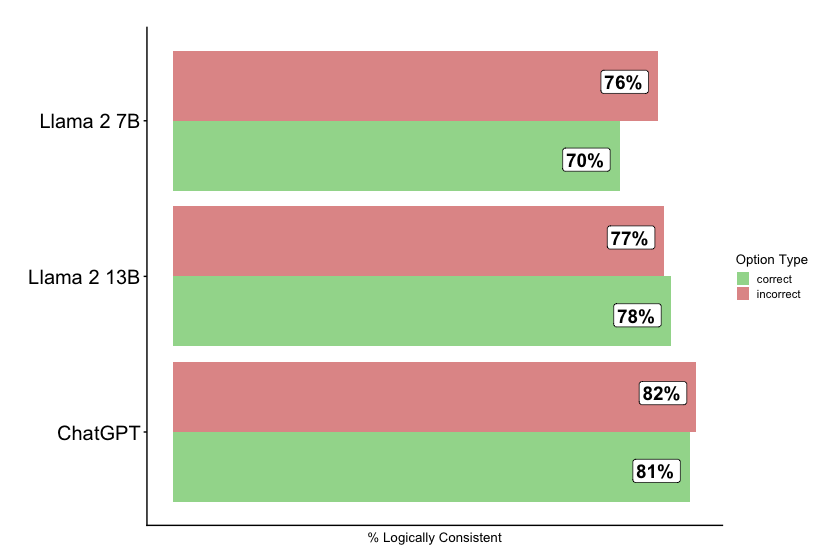
The image is a horizontal bar chart comparing the logical consistency of three language models: Llama 2 7B, Llama 2 13B, and ChatGPT. The chart displays the percentage of logically consistent responses for both correct and incorrect options.
### Components/Axes
* **Y-axis:** Categorical axis listing the language models: Llama 2 7B, Llama 2 13B, and ChatGPT.
* **X-axis:** Numerical axis labeled "% Logically Consistent". The scale ranges implicitly from 0% to 100%.
* **Legend (Top-Right):**
* Green: "correct"
* Red: "incorrect"
### Detailed Analysis
The chart presents two bars for each language model, representing the percentage of logically consistent responses for correct and incorrect options.
* **Llama 2 7B:**
* Correct (Green): 70%
* Incorrect (Red): 76%
* **Llama 2 13B:**
* Correct (Green): 78%
* Incorrect (Red): 77%
* **ChatGPT:**
* Correct (Green): 81%
* Incorrect (Red): 82%
### Key Observations
* ChatGPT shows the highest logical consistency for both correct and incorrect options.
* Llama 2 7B has the lowest logical consistency for correct options.
* For Llama 2 13B, the percentage of logically consistent responses is slightly higher for correct options (78%) than for incorrect options (77%).
* For all models, the percentage of logically consistent responses is very similar for correct and incorrect options, with differences of 1-6%.
### Interpretation
The chart suggests that ChatGPT exhibits the best logical consistency among the three models tested. The proximity of the "correct" and "incorrect" bars for each model indicates that logical consistency is not strongly dependent on the correctness of the option. This could imply that the models are consistently applying logic, regardless of whether the conclusion is correct or not. The small differences between correct and incorrect options suggest that the models' logical reasoning is somewhat independent of the factual accuracy of the input or desired output.