## Bar Chart: Logical Consistency of AI Models
### Overview
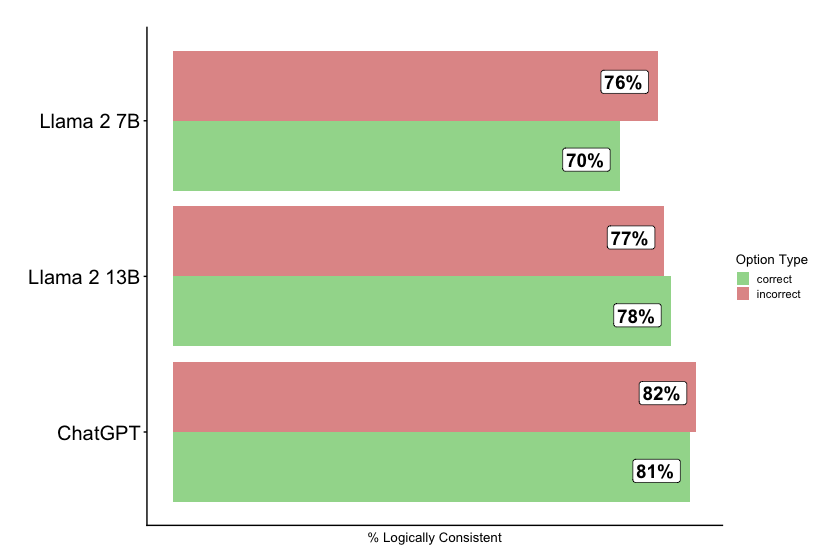
The chart compares the logical consistency of three AI models (Llama 2 7B, Llama 2 13B, and ChatGPT) using split bars to represent percentages of "correct" and "incorrect" responses. The x-axis shows "% Logically Consistent," while the y-axis lists the models. Green segments represent correct responses, and red segments represent incorrect responses.
### Components/Axes
- **X-axis**: Labeled "% Logically Consistent" (percentage scale).
- **Y-axis**: Categorical axis listing models:
- Llama 2 7B (top)
- Llama 2 13B (middle)
- ChatGPT (bottom)
- **Legend**:
- Green = Correct
- Red = Incorrect
- **Data Labels**: Percentages displayed in white boxes on each bar segment.
### Detailed Analysis
1. **Llama 2 7B**:
- Correct: 70% (green)
- Incorrect: 76% (red)
2. **Llama 2 13B**:
- Correct: 78% (green)
- Incorrect: 77% (red)
3. **ChatGPT**:
- Correct: 81% (green)
- Incorrect: 82% (red)
### Key Observations
- **ChatGPT** outperforms both Llama models in correct responses (81% vs. 78% and 70%).
- **Llama 2 13B** shows improved logical consistency over Llama 2 7B (+8% correct, -6% incorrect).
- All models have incorrect response rates above 75%, with ChatGPT having the highest (82%).
- The split-bar design highlights the trade-off between correct and incorrect responses across models.
### Interpretation
The data suggests that larger model sizes (e.g., Llama 2 13B) correlate with better logical consistency than smaller models (Llama 2 7B). However, ChatGPT dominates both metrics, indicating superior performance. The high incorrect rates across all models highlight a systemic challenge in achieving logical consistency, even for advanced systems. The red segments (incorrect) consistently exceed green segments (correct) for all models, suggesting a need for targeted improvements in reasoning capabilities.