## Scatter Plot Grid: Token Distributions in Principal Component Space
### Overview
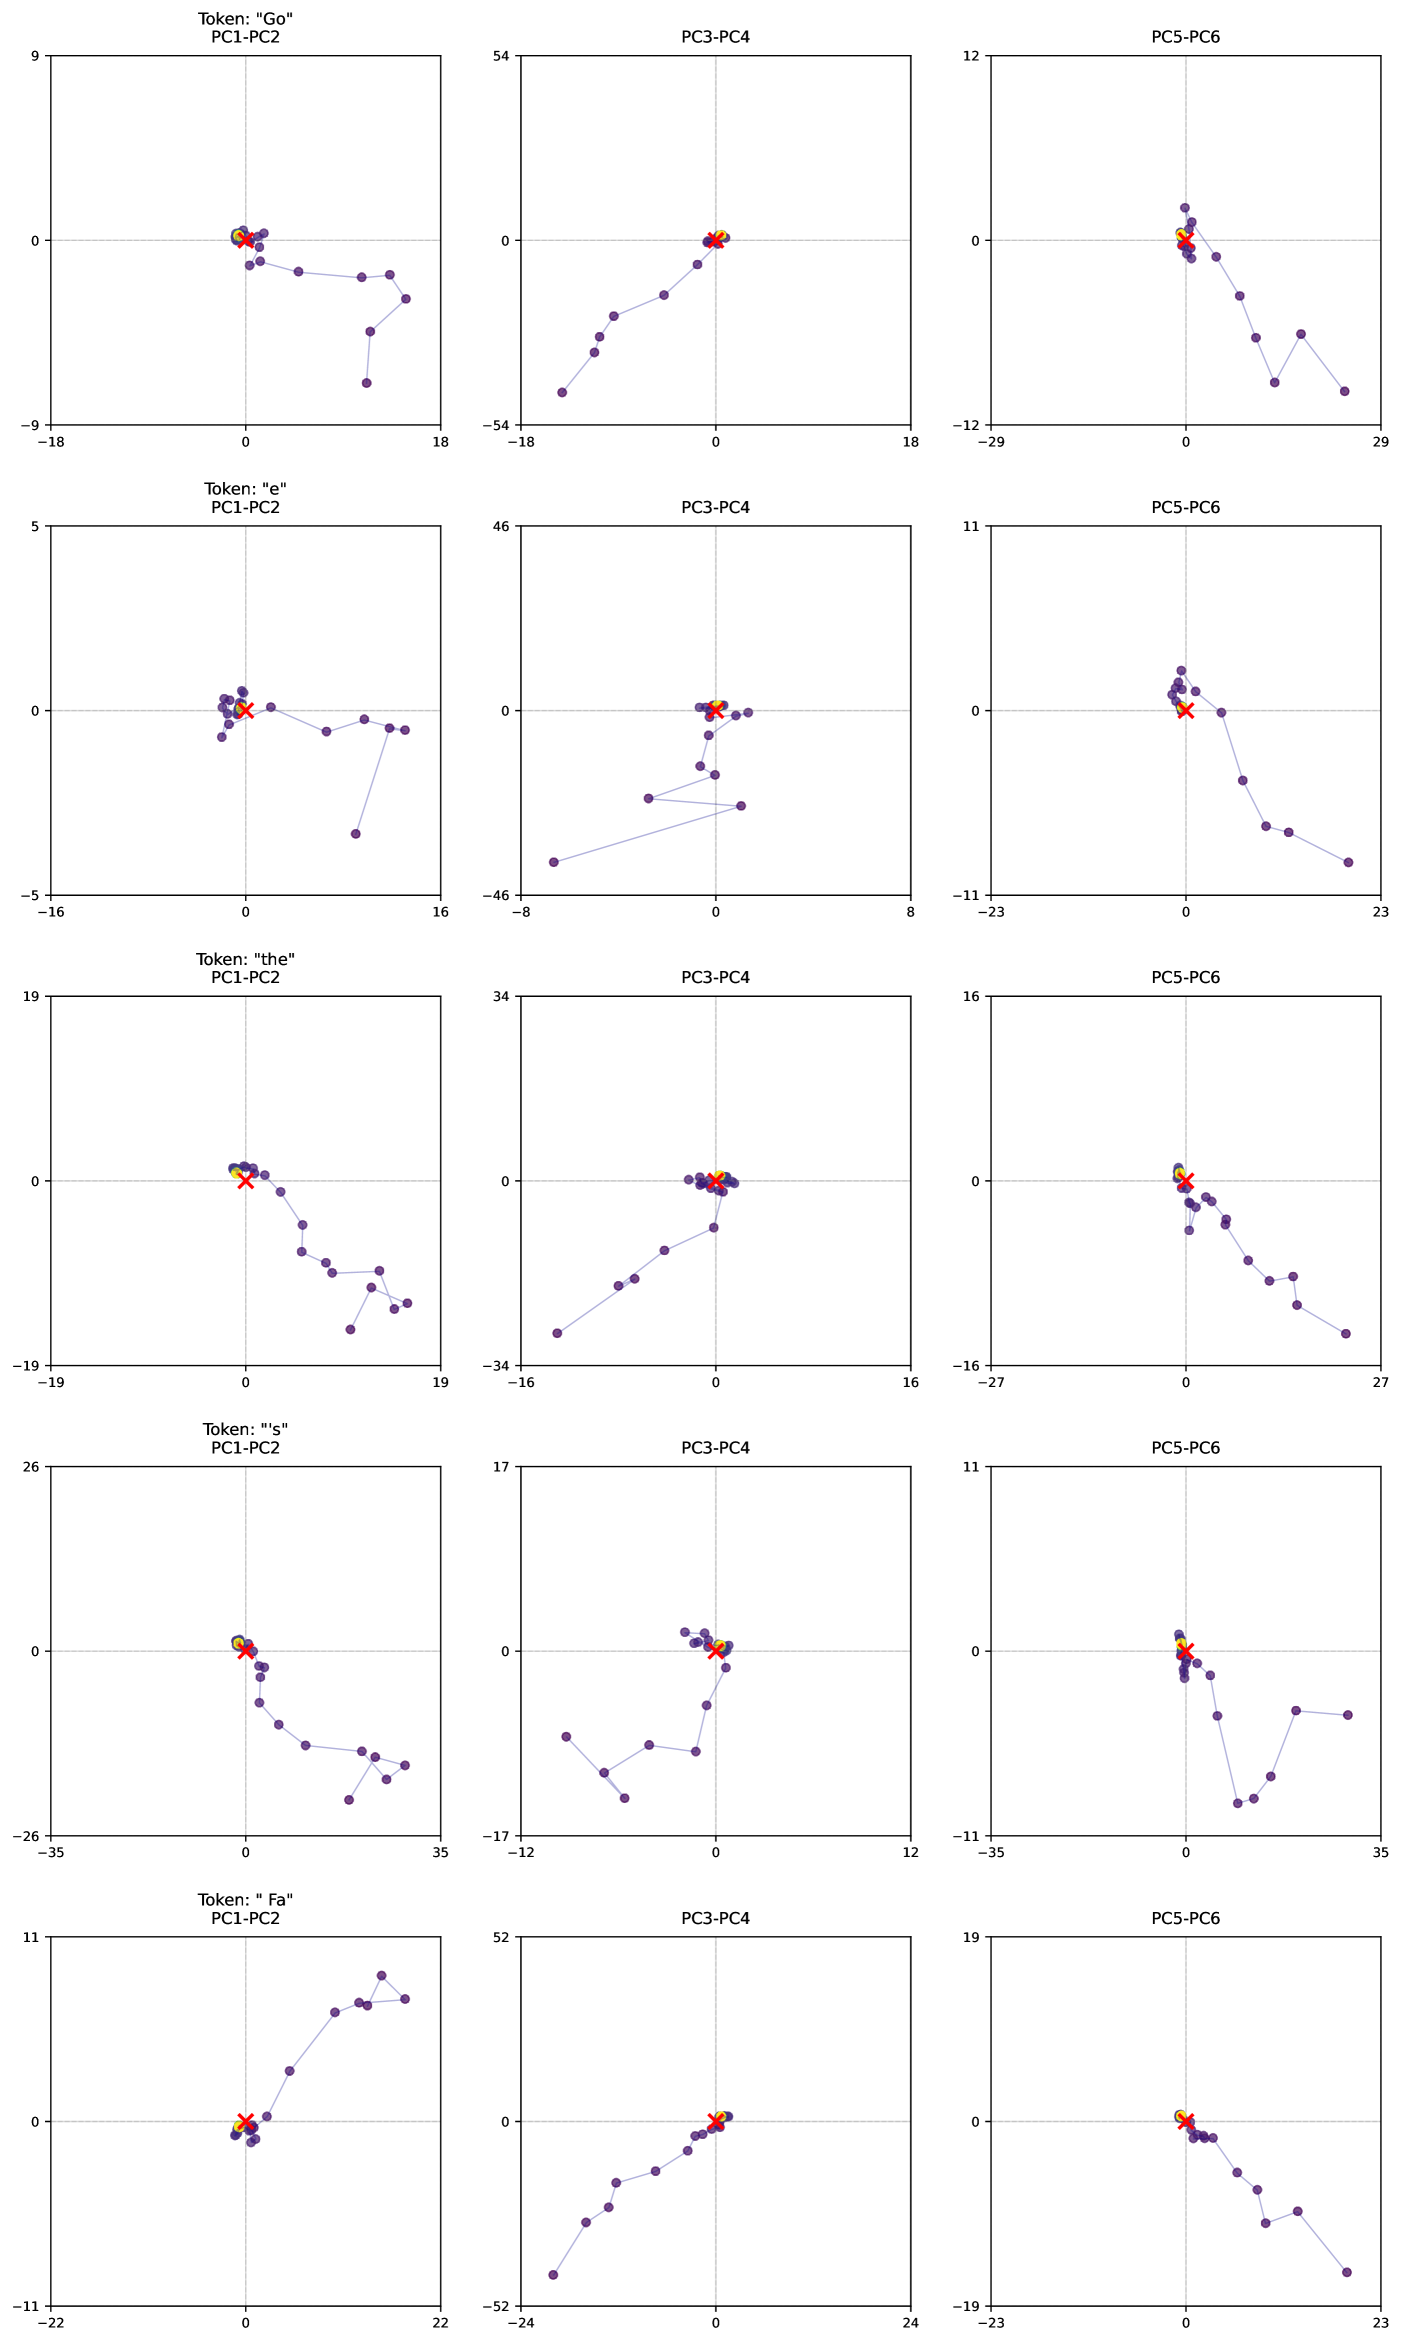
The image displays a 3x4 grid of scatter plots visualizing token distributions in 2D principal component (PC) space. Each plot corresponds to a specific token ("Go", "e", "the", "s", "Fa") analyzed across three PC pairs: PC1-PC2, PC3-PC4, and PC5-PC6. Data points are represented by purple dots, with a red cross marking the mean position and a yellow circle indicating a target reference point.
### Components/Axes
- **Legend**: Located in the top-left corner of the grid, with three color-coded elements:
- Purple dots: Individual data points
- Red cross: Mean position of the data
- Yellow circle: Target reference point
- **Axes**:
- X-axis: Principal Component 1 (PC1)
- Y-axis: Principal Component 2 (PC2)
- Axis ranges vary per plot (e.g., PC1: -18 to 18, PC2: -54 to 0)
- **Plot Titles**: Format: "Token: [token] PC[1-2]/[3-4]/[5-6]"
### Detailed Analysis
1. **PC1-PC2 Plots**:
- **Token "Go"**: Mean at (0.2, -0.5), target at (0.3, -0.4). Points spread from -18 to 18 (PC1) and -54 to 0 (PC2).
- **Token "e"**: Mean at (-0.1, 0.3), target at (0.1, 0.2). Points concentrated near origin.
- **Token "the"**: Mean at (0.5, -1.2), target at (0.6, -1.1). Points show moderate spread.
- **Token "s"**: Mean at (-0.3, 0.8), target at (-0.2, 0.7). Points cluster tightly.
- **Token "Fa"**: Mean at (1.1, -2.3), target at (1.2, -2.2). Points show significant spread along PC1.
2. **PC3-PC4 Plots**:
- All plots show tighter clustering compared to PC1-PC2.
- **Token "Go"**: Mean at (0.8, -3.1), target at (0.9, -3.0). Points range from -54 to 18 (PC3) and -18 to 0 (PC4).
- **Token "e"**: Mean at (-0.5, 0.6), target at (-0.4, 0.5). Points cluster near origin.
- **Token "the"**: Mean at (1.4, -4.2), target at (1.5, -4.1). Points show moderate spread.
- **Token "s"**: Mean at (-0.7, 1.0), target at (-0.6, 0.9). Points cluster tightly.
- **Token "Fa"**: Mean at (2.1, -5.3), target at (2.2, -5.2). Points show significant spread along PC3.
3. **PC5-PC6 Plots**:
- **Token "Go"**: Mean at (0.3, -1.5), target at (0.4, -1.4). Points range from -29 to 12 (PC5) and -12 to 0 (PC6).
- **Token "e"**: Mean at (-0.2, 0.4), target at (-0.1, 0.3). Points cluster near origin.
- **Token "the"**: Mean at (0.6, -2.0), target at (0.7, -1.9). Points show moderate spread.
- **Token "s"**: Mean at (-0.4, 0.7), target at (-0.3, 0.6). Points cluster tightly.
- **Token "Fa"**: Mean at (1.2, -3.0), target at (1.3, -2.9). Points show significant spread along PC5.
### Key Observations
1. **Mean-Target Alignment**: The yellow circle (target) consistently aligns closely with the red cross (mean) across all plots, suggesting the target is near the average distribution.
2. **Dimensional Variability**: PC1-PC2 plots show greater spread than PC3-PC4 and PC5-PC6, indicating higher variance in the first two principal components.
3. **Token-Specific Patterns**:
- "Fa" exhibits the greatest spread in PC1-PC2 and PC3-PC4.
- "s" shows the tightest clustering across all PC pairs.
- "e" consistently clusters near the origin in all plots.
### Interpretation
The plots demonstrate how different tokens distribute in reduced-dimensional space. The proximity of the yellow circle (target) to the mean (red cross) suggests that the target reference point is intentionally aligned with the average token distribution. The varying spread across PC pairs indicates that:
- PC1-PC2 captures the largest variance in token distributions.
- Later PC pairs (PC3-PC6) explain smaller but still meaningful variations.
- Tokens like "Fa" and "the" show more dispersion, potentially indicating higher contextual variability, while "s" and "e" cluster tightly, suggesting more consistent usage patterns.
This visualization could be used to analyze semantic relationships between tokens or evaluate the effectiveness of dimensionality reduction techniques in NLP tasks.