## Scatter Plot: Music Genre Distribution Across Valid and Test Sets
### Overview
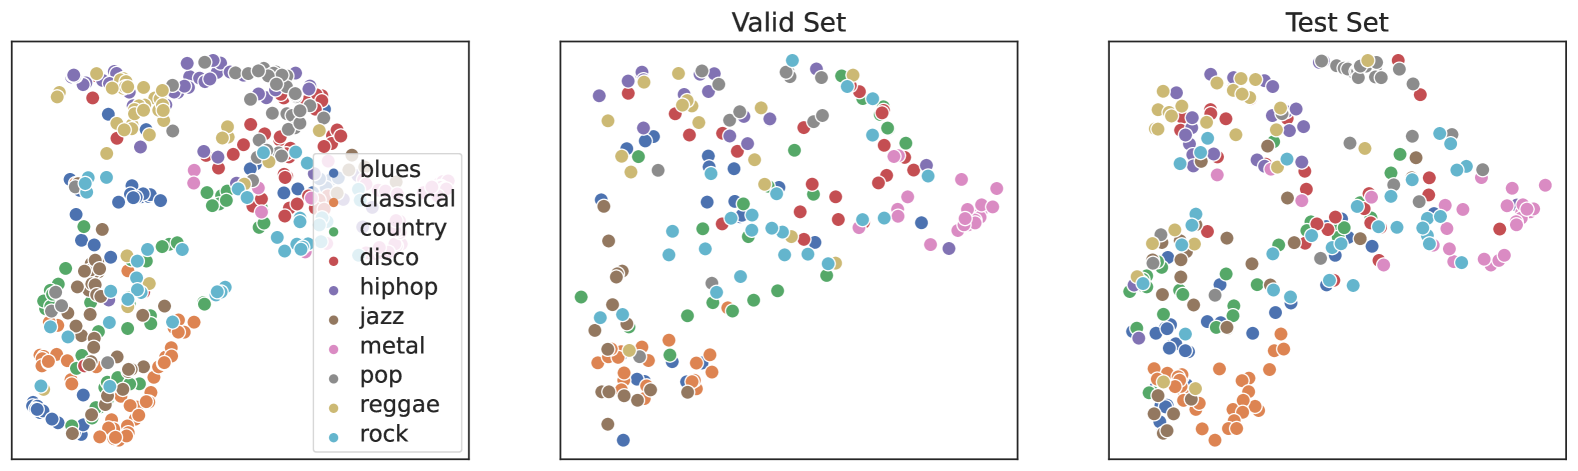
The image contains three scatter plots visualizing the distribution of music genres across datasets. The first plot (unlabeled) appears to represent a training set, while the second and third plots are explicitly labeled "Valid Set" and "Test Set." Each plot uses color-coded dots to represent 10 distinct music genres, as defined in the legend.
### Components/Axes
- **Legend**: Positioned on the left side of the image, mapping 10 genres to colors:
- Blues (dark blue)
- Classical (orange)
- Country (green)
- Disco (red)
- Hiphop (purple)
- Jazz (brown)
- Metal (pink)
- Pop (gray)
- Reggae (yellow)
- Rock (light blue)
- **Plots**:
- **Unlabeled Plot (Left)**: Likely the training set, with dense clusters of genres.
- **Valid Set (Center)**: Intermediate distribution, showing partial clustering.
- **Test Set (Right)**: More dispersed distribution, with overlapping genres.
- **Axes**: No explicit axis labels or scales are visible, but the x- and y-axes span the same range across all plots.
### Detailed Analysis
1. **Unlabeled Plot (Training Set)**:
- **Blues (dark blue)**: Clustered in the top-left quadrant.
- **Classical (orange)**: Dense cluster in the bottom-left.
- **Country (green)**: Spread across the middle.
- **Disco (red)**: Concentrated in the middle-right.
- **Hiphop (purple)**: Top-right cluster.
- **Jazz (brown)**: Bottom-left, overlapping with classical.
- **Metal (pink)**: Top-right, overlapping with hiphop.
- **Pop (gray)**: Scattered throughout.
- **Reggae (yellow)**: Top-left cluster.
- **Rock (light blue)**: Bottom-right cluster.
2. **Valid Set (Center)**:
- **Blues**: Less dense, spread toward the middle.
- **Classical**: Still concentrated in the bottom-left but slightly dispersed.
- **Country**: More dispersed, occupying the central region.
- **Disco**: Spread toward the middle-right.
- **Hiphop**: Top-right cluster, slightly smaller.
- **Jazz**: Bottom-left, less overlapping with classical.
- **Metal**: Top-right, smaller cluster.
- **Pop**: Widely scattered.
- **Reggae**: Top-left, smaller cluster.
- **Rock**: Bottom-right, smaller cluster.
3. **Test Set (Right)**:
- **Blues**: Dispersed across the top-left.
- **Classical**: Spread from bottom-left to middle.
- **Country**: Scattered throughout the middle.
- **Disco**: Middle-right, less concentrated.
- **Hiphop**: Top-right, smaller and more dispersed.
- **Jazz**: Bottom-left, minimal overlap.
- **Metal**: Top-right, highly dispersed.
- **Pop**: Widely distributed.
- **Reggae**: Top-left, minimal cluster.
- **Rock**: Bottom-right, smaller and spread out.
### Key Observations
- **Cluster Density**: The training set shows the most distinct genre clusters, while the test set exhibits significant overlap and dispersion.
- **Genre-Specific Trends**:
- **Metal (pink)** and **Hiphop (purple)** show the most pronounced clustering in the training set but become highly dispersed in the test set.
- **Classical (orange)** and **Rock (light blue)** maintain some density in the training and valid sets but are more fragmented in the test set.
- **Pop (gray)** remains the most uniformly distributed across all plots.
- **Overlap**: Jazz (brown) and Classical (orange) overlap in the training set’s bottom-left, suggesting potential ambiguity in genre classification.
### Interpretation
The data suggests that the model trained on the clustered training set may have overfit to specific genre distributions, as evidenced by the reduced separation in the valid and test sets. Genres like Metal and Hiphop, which are tightly grouped in the training data, become ambiguous in the test set, indicating potential challenges in generalization. The dispersion of genres in the test set highlights the importance of robust feature engineering to distinguish overlapping categories. Additionally, the consistent spread of Pop across all plots suggests it may serve as a baseline for comparison in model performance evaluation.