# Technical Document Extraction: F1-Score Analysis Across Data Proportions
## Chart Description
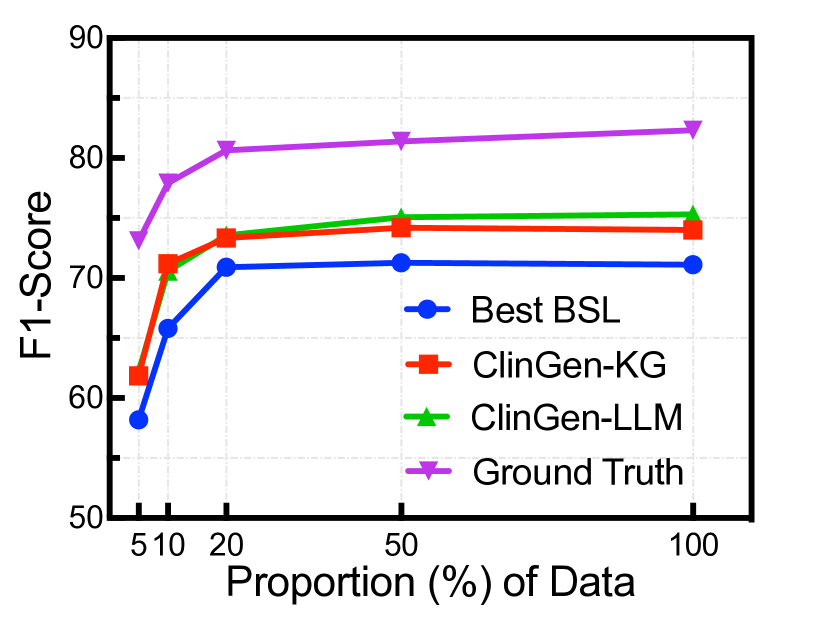
The image is a line graph comparing F1-Scores of different models across varying proportions of data. The graph includes four distinct lines with markers, a legend, and grid lines for reference.
---
### **Axis Labels and Markers**
- **X-Axis (Horizontal):**
- Title: `Proportion (%) of Data`
- Markers: `5`, `10`, `20`, `50`, `100`
- Scale: Linear progression from 5% to 100%
- **Y-Axis (Vertical):**
- Title: `F1-Score`
- Range: `50` to `90`
- Increment: 10 units
---
### **Legend and Line Details**
The legend identifies four models with corresponding colors and markers:
1. **Best BSL**
- Color: Blue
- Marker: Circle (`●`)
- Line: Solid
2. **ClinGen-KG**
- Color: Red
- Marker: Square (`■`)
- Line: Solid
3. **ClinGen-LLM**
- Color: Green
- Marker: Triangle (`▲`)
- Line: Solid
4. **Ground Truth**
- Color: Purple
- Marker: Triangle (`▲`)
- Line: Solid
---
### **Key Trends and Data Points**
1. **Ground Truth**
- Starts at **73%** F1-Score at 5% data proportion.
- Increases steadily to **82%** at 100% data proportion.
- Maintains the highest F1-Score across all proportions.
2. **Best BSL**
- Begins at **58%** F1-Score at 5% data.
- Sharp increase to **70%** at 10% data.
- Plateaus at **70%** from 10% to 100% data.
3. **ClinGen-KG**
- Starts at **62%** F1-Score at 5% data.
- Rises to **72%** at 10% data.
- Remains stable at **73–74%** from 20% to 100% data.
4. **ClinGen-LLM**
- Begins at **60%** F1-Score at 5% data.
- Increases to **73%** at 10% data.
- Stays consistent at **73–74%** from 20% to 100% data.
---
### **Cross-Reference Validation**
- **Legend Colors vs. Line Colors:**
- Blue (`Best BSL`) matches the blue line with circles.
- Red (`ClinGen-KG`) matches the red line with squares.
- Green (`ClinGen-LLM`) matches the green line with triangles.
- Purple (`Ground Truth`) matches the purple line with triangles.
- **Marker Consistency:**
- All markers align with their respective lines (e.g., circles for Best BSL, squares for ClinGen-KG).
---
### **Summary**
The graph demonstrates that **Ground Truth** consistently outperforms all models, with **ClinGen-LLM** and **ClinGen-KG** achieving similar performance at higher data proportions. **Best BSL** lags behind but shows a significant improvement at 10% data. No data table is present in the image.