## Information Flow Diagram: Answer Text Analysis
### Overview
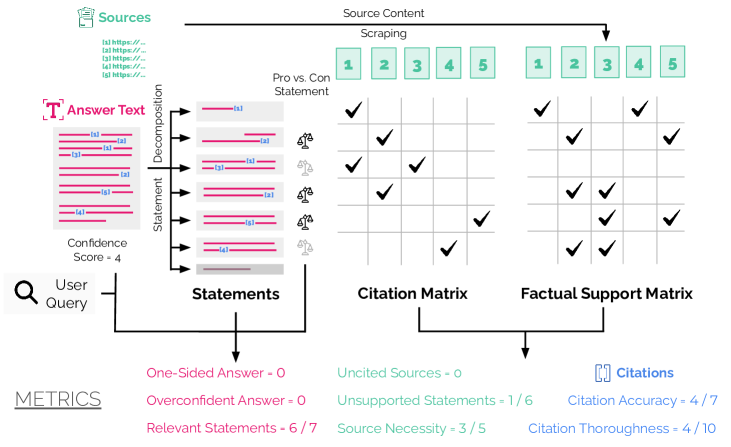
The image is a diagram illustrating the process of analyzing answer text, likely generated by a language model, by comparing it against source content. The diagram shows the flow from sources to answer text, decomposition into statements, comparison with source content via citation and factual support matrices, and finally, metrics related to the answer's quality.
### Components/Axes
* **Sources:** A list of five URLs, labeled \[1] through \[5].
* **Source Content:** Represented by two sets of five blocks, labeled 1 through 5, indicating source content being scraped.
* **Answer Text:** A block of text with a "T" icon, decomposed into multiple statements.
* **Confidence Score:** A numerical value of 4 associated with the answer text.
* **User Query:** Represented by a magnifying glass icon.
* **Statement Decomposition:** The process of breaking down the answer text into individual statements.
* **Statements:** A series of six statements, labeled \[1] through \[6], with indicators of whether they are "Pro vs. Con" statements.
* **Citation Matrix:** A grid showing which sources are cited by which statements.
* **Factual Support Matrix:** A grid showing which statements are factually supported by which sources.
* **Metrics:** A list of metrics evaluating the answer, including:
* One-Sided Answer: 0
* Overconfident Answer: 0
* Relevant Statements: 6/7
* Uncited Sources: 0
* Unsupported Statements: 1/6
* Source Necessity: 3/5
* Citation Accuracy: 4/7
* Citation Thoroughness: 4/10
* **Icons:**
* Document Icon: Associated with "Sources"
* "T" Icon: Associated with "Answer Text"
* Magnifying Glass Icon: Associated with "User Query"
* Scales Icon: Associated with "Pro vs. Con Statement"
* Document Icon with Brackets: Associated with "Citations"
### Detailed Analysis
* **Sources:** Five sources are listed, presumably web pages, indicated by URLs.
* **Source Content Scraping:** The diagram shows the content from these sources being scraped.
* **Answer Text:** The answer text is decomposed into six statements. Each statement is labeled \[1] through \[6].
* **Statement Decomposition:** The answer text is broken down into individual statements.
* **Pro vs. Con Statement:** Each statement has an associated "Pro vs. Con" indicator, represented by a scales icon. The last statement's icon is greyed out, suggesting it is neither pro nor con.
* **Citation Matrix:** This matrix shows the relationship between statements and sources. A checkmark indicates that a statement cites a particular source.
* Statement 1 cites sources 1 and 4.
* Statement 2 cites source 2.
* Statement 3 cites sources 1 and 3.
* Statement 4 cites source 5.
* Statement 5 cites source 4.
* **Factual Support Matrix:** This matrix shows whether the statements are factually supported by the sources. A checkmark indicates that a statement is supported by a particular source.
* Statement 1 is supported by sources 1 and 2.
* Statement 2 is supported by sources 2 and 3.
* Statement 3 is supported by sources 2 and 3.
* Statement 4 is supported by sources 4 and 5.
* Statement 5 is supported by source 5.
* **Metrics:** The metrics provide a quantitative assessment of the answer.
* The answer is not one-sided or overconfident.
* 6 out of 7 statements are relevant.
* No sources are uncited.
* 1 out of 6 statements is unsupported.
* 3 out of 5 sources are necessary.
* Citation accuracy is 4/7.
* Citation thoroughness is 4/10.
### Key Observations
* The diagram illustrates a pipeline for evaluating the quality of an answer generated from multiple sources.
* The matrices provide a structured way to assess citation and factual support.
* The metrics offer a summary of the answer's strengths and weaknesses.
### Interpretation
The diagram presents a comprehensive approach to evaluating the quality of an answer generated from multiple sources. The process involves decomposing the answer into individual statements, comparing these statements against the source content, and calculating metrics to assess the answer's accuracy, relevance, and thoroughness.
The matrices are crucial for identifying potential issues such as unsupported statements or inaccurate citations. The metrics provide a high-level overview of the answer's quality, allowing for quick identification of areas that need improvement.
The "Pro vs. Con" indicator suggests that the system is also considering the sentiment or stance of each statement, which is important for ensuring a balanced and unbiased answer. The greyed out scales icon for the last statement indicates that it is neither pro nor con, suggesting a neutral or background statement.
The metrics show that the answer has some weaknesses. While the answer is not one-sided or overconfident, and most statements are relevant, the citation accuracy and thoroughness are relatively low (4/7 and 4/10, respectively). This suggests that the answer may not be citing all relevant sources or that the citations may not be entirely accurate. Additionally, 1/6 statements are unsupported, indicating a potential factual issue.