\n
## Diagram: Answer Decomposition and Factual Support
### Overview
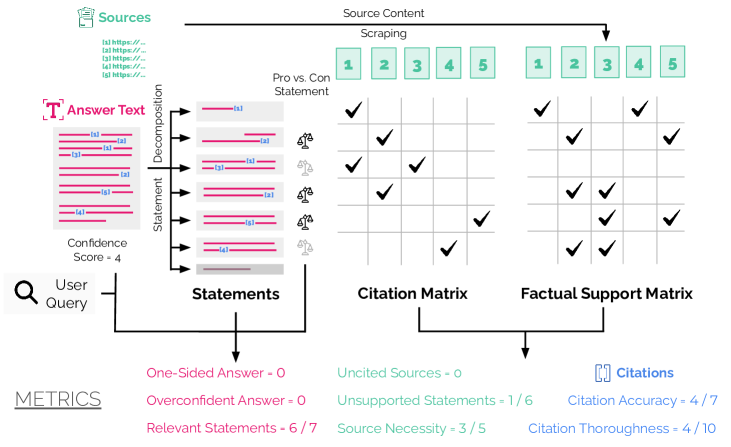
This diagram illustrates a process for decomposing a user query into statements, extracting supporting evidence from sources, and evaluating the quality of the answer. It shows the flow from a user query to answer text, with intermediate steps involving statement decomposition, citation matrix creation, and factual support assessment. The diagram also presents several metrics used to evaluate the system's performance.
### Components/Axes
The diagram is segmented into four main areas: Sources, Answer Text Decomposition, Citation/Factual Support Matrices, and Metrics.
* **Sources:** Lists URLs labeled as "[a] https://...", "[b] https://...", "[c] https://...", "[d] https://...", "[e] https://...".
* **Answer Text:** Displays a series of statements, each labeled "[a]", "[b]", "[c]", "[d]", "[e]", "[f]". Each statement is represented by a horizontal pink bar. A "Confidence Score" of 4 is indicated.
* **Statements:** A rectangular block labeled "Statements".
* **Citation Matrix:** A grid with columns labeled "1", "2", "3", "4", "5" and rows corresponding to the statements. Checkmarks indicate citation support. The title above the matrix is "Pro vs. Con Statement".
* **Factual Support Matrix:** A grid with columns labeled "1", "2", "3", "4", "5" and rows corresponding to the statements. Checkmarks indicate factual support.
* **Metrics:** Lists several performance metrics: "One-Sided Answer - 0", "Uncited Sources - 0", "Citations", "Overconfident Answer - 0", "Unsupported Statements - 1/6", "Citation Accuracy - 4/7", "Relevant Statements - 6/7", "Source Necessity - 3/5", "Citation Thoroughness - 4/10".
* **User Query:** Represented by a magnifying glass icon.
* **Decomposition:** An arrow labeled "Decomposition" connects the Answer Text to the Statements block.
* **Source Content Scraping:** A block labeled "Source Content Scraping" with numbers 1-5.
### Detailed Analysis or Content Details
The diagram shows a flow of information:
1. A **User Query** initiates the process.
2. The **Answer Text** is generated, consisting of six statements ([a] through [f]), each with a confidence score of 4.
3. These statements are decomposed into individual components and represented in the **Statements** block.
4. **Source Content Scraping** is performed on five sources ([1] through [5]).
5. The **Citation Matrix** assesses the support for each statement from each source. The matrix shows that:
* Statement [a] is supported by sources 2, 3, and 4.
* Statement [b] is supported by sources 1, 2, and 3.
* Statement [c] is supported by source 5.
* Statement [d] is supported by sources 1, 2, 3, 4, and 5.
* Statement [e] is supported by sources 1, 2, 3, and 4.
* Statement [f] is supported by sources 1, 2, and 3.
6. The **Factual Support Matrix** assesses the factual support for each statement from each source. The matrix shows that:
* Statement [a] is factually supported by sources 2 and 3.
* Statement [b] is factually supported by sources 1, 2, and 3.
* Statement [c] is factually supported by source 5.
* Statement [d] is factually supported by sources 1, 2, 3, 4, and 5.
* Statement [e] is factually supported by sources 1, 2, 3, and 4.
* Statement [f] is factually supported by sources 1, 2, and 3.
7. The process is evaluated using the **Metrics** listed at the bottom.
### Key Observations
* The system appears to be performing well, with a "Relevant Statements" score of 6/7 and no "One-Sided Answer" or "Overconfident Answer".
* There is one unsupported statement out of six ("Unsupported Statements - 1/6").
* Citation accuracy is moderate (4/7), and citation thoroughness is relatively low (4/10).
* Source necessity is moderate (3/5).
* The citation and factual support matrices show varying levels of support across different statements and sources. Statement [d] has the most support from all sources.
### Interpretation
This diagram represents a pipeline for generating answers to user queries based on multiple sources. The decomposition of the answer into individual statements allows for granular assessment of factual support and citation accuracy. The metrics provide a quantitative evaluation of the system's performance, highlighting areas for improvement. The difference between the Citation Matrix and the Factual Support Matrix suggests that while a source may *cite* a statement, it doesn't necessarily *factually support* it, indicating a need for more nuanced evaluation of source credibility and content. The relatively low "Citation Thoroughness" score suggests that the system could benefit from exploring a wider range of sources or providing more comprehensive citations. The diagram suggests a focus on building a system that not only provides answers but also demonstrates the evidence supporting those answers, and assesses the confidence and reliability of that evidence.