TECHNICAL ASSET FINGERPRINT
e00cf6fd9244b93e87004524
Click to view fullscreen
Press ESC or click to close
FOUND IN PAPERS
EXPERT: healer-alpha-free VERSION 1
RUNTIME: free/openrouter/healer-alpha
INTEL_VERIFIED
## Diagram: Answer Quality Evaluation Pipeline
### Overview
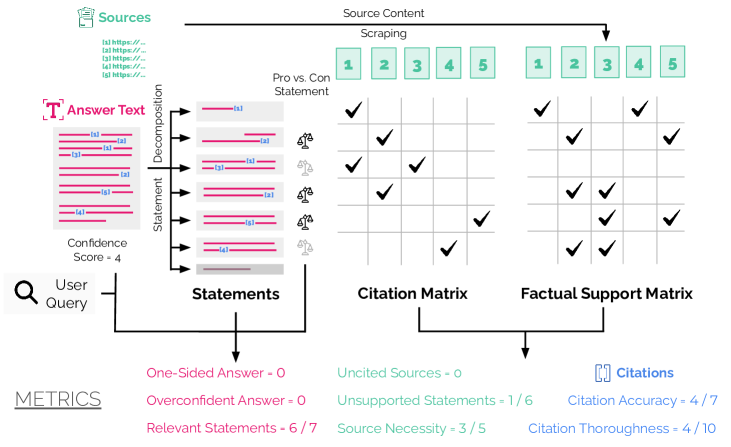
This image is a technical flowchart illustrating a multi-step process for evaluating the quality, citation accuracy, and factual support of a generated answer to a user query. The pipeline decomposes an answer into individual statements, cross-references them against source materials, and produces quantitative metrics.
### Components/Axes
The diagram is organized into several interconnected regions:
1. **Top-Left: Sources**
* A green header labeled "Sources".
* A list of five placeholder URLs, labeled `1) https://...`, `2) https://...`, `3) https://...`, `4) https://...`, `5) https://...`.
* An arrow labeled "Source Content" points from this list to the "Scraping" process.
2. **Top-Center: Scraping & Pro vs. Con Statement**
* A process labeled "Scraping" that outputs five numbered green boxes (`1`, `2`, `3`, `4`, `5`), representing processed source content.
* Below this, a label "Pro vs. Con Statement" points to two grids (the matrices).
3. **Left: Answer Text Decomposition**
* A pink header labeled "Answer Text" with a large "T" icon.
* A block of text with pink highlighting, representing the full answer.
* An arrow labeled "Decomposition" points to a vertical list of seven individual statements, labeled `S1` through `S7`. Each statement is a pink bar with embedded source citations (e.g., `[S1]`, `[S2]`, `[S3]`).
* To the right of each statement bar are small icons: a person (👤) and a magnifying glass (🔍), likely representing "user" and "verification" steps.
* A "Confidence Score = 4" is noted below the answer text block.
4. **Center: Matrices**
* **Citation Matrix (Left Grid):** A 7-row (for statements S1-S7) by 5-column (for sources 1-5) grid. Cells contain black checkmarks (✓) indicating which source is cited by which statement.
* **Factual Support Matrix (Right Grid):** An identical 7x5 grid. Checkmarks here indicate which source provides factual support for the claim made in the statement.
* Both matrices are under the header "Pro vs. Con Statement".
5. **Bottom: Metrics**
* A section labeled "METRICS" in the bottom-left.
* Three columns of metrics with colored text:
* **Left Column (Pink):** `One-Sided Answer = 0`, `Overconfident Answer = 0`, `Relevant Statements = 6 / 7`.
* **Middle Column (Green):** `Uncited Sources = 0`, `Unsupported Statements = 1 / 6`, `Source Necessity = 3 / 5`.
* **Right Column (Blue):** `[ ] Citations` (header), `Citation Accuracy = 4 / 7`, `Citation Thoroughness = 4 / 10`.
6. **Flow Arrows:**
* A "User Query" (magnifying glass icon) feeds into the "Statements" list.
* The "Statements" list feeds into both the "Citation Matrix" and the "Factual Support Matrix".
* Both matrices feed into the "METRICS" section.
### Detailed Analysis
**Statement Decomposition & Citations:**
* The answer is broken into 7 statements (S1-S7).
* Visual inspection of the pink bars shows embedded citations:
* S1: `[S1]`
* S2: `[S2]`
* S3: `[S3]`
* S4: `[S1][S2]`
* S5: `[S3]`
* S6: `[S2]`
* S7: `[S1]`
**Citation Matrix (Checkmark Placement):**
* **Row S1:** Checkmark in Column 1. (Matches citation `[S1]`)
* **Row S2:** Checkmark in Column 2. (Matches citation `[S2]`)
* **Row S3:** Checkmark in Column 3. (Matches citation `[S3]`)
* **Row S4:** Checkmarks in Columns 1 and 2. (Matches citations `[S1][S2]`)
* **Row S5:** Checkmark in Column 3. (Matches citation `[S3]`)
* **Row S6:** Checkmark in Column 2. (Matches citation `[S2]`)
* **Row S7:** Checkmark in Column 1. (Matches citation `[S1]`)
**Factual Support Matrix (Checkmark Placement):**
* **Row S1:** Checkmark in Column 1.
* **Row S2:** Checkmark in Column 2.
* **Row S3:** Checkmarks in Columns 3 and 5.
* **Row S4:** Checkmarks in Columns 1 and 2.
* **Row S5:** Checkmark in Column 3.
* **Row S6:** Checkmarks in Columns 2 and 4.
* **Row S7:** Checkmark in Column 1.
**Metrics Values:**
* **Relevant Statements:** 6 out of 7 statements are deemed relevant.
* **Unsupported Statements:** 1 out of 6 cited statements lacks factual support. (This implies S3, S4, S5, S6, S7 are supported, but one is not. Cross-referencing matrices: S1, S2, S4, S5, S6, S7 have matching support checks for their citations. S3 cites only S3 but is supported by S3 and S5, so it is supported. The metric may refer to a statement not shown or a different calculation.)
* **Source Necessity:** 3 out of 5 sources are necessary. (Sources 1, 2, and 3 are cited and support statements. Sources 4 and 5 are only used for support in S6 and S3 respectively, but are not cited themselves, making them "uncited sources" but still providing support.)
* **Citation Accuracy:** 4 out of 7 citations are accurate. (This suggests that while the matrices show checkmarks for citations, only 4 of the 7 citation instances (e.g., `[S1]` in S1, `[S2]` in S2, etc.) are considered fully accurate, possibly due to context or precision issues not visible in the diagram.)
* **Citation Thoroughness:** 4 out of 10. (This low score suggests the answer missed citing 6 relevant source points. The denominator (10) likely represents the total number of relevant source-statement connections that *could* have been cited, based on the Factual Support Matrix.)
### Key Observations
1. **Discrepancy Between Citation and Support:** The Factual Support Matrix shows more checkmarks than the Citation Matrix. For example, Statement S3 is factually supported by both Source 3 and Source 5, but only cites Source 3. Statement S6 is supported by Sources 2 and 4 but only cites Source 2.
2. **Uncited but Supportive Sources:** Sources 4 and 5 provide factual support (for S6 and S3, respectively) but are never cited in the answer text. This contributes to the "Source Necessity" score of 3/5.
3. **Metric Inconsistency:** The "Unsupported Statements = 1 / 6" metric is puzzling. Visually, all 6 cited statements (S1-S6, excluding the uncited S7?) have at least one matching checkmark in the Factual Support Matrix. This may indicate a deeper analysis of the *quality* of support not visible in the binary checkmarks.
4. **Low Thoroughness Score:** The "Citation Thoroughness = 4 / 10" is the lowest score, indicating the answer failed to cite a majority of the available supporting evidence from the sources.
### Interpretation
This diagram models an automated or semi-automated system for auditing AI-generated answers. It moves beyond simple keyword matching to evaluate the logical and evidential structure of a response.
The core insight is the separation of **citation** (what the answer *claims* to use) from **factual support** (what the sources *actually* substantiate). The pipeline reveals weaknesses in the answer:
* **Incomplete Citation:** The answer omits citations for relevant information present in Sources 4 and 5.
* **Potential Overclaiming:** The low "Citation Accuracy" (4/7) suggests some citations may be misplaced, overly broad, or not precisely supporting the statement they are attached to.
* **Thoroughness Gap:** The answer is not thorough; it leaves a significant amount of available source evidence unused (6 out of 10 relevant connections uncited).
The "Metrics" section provides a quantitative dashboard for these qualitative issues. A perfect answer would have: `Unsupported Statements = 0/7`, `Source Necessity = 5/5`, `Citation Accuracy = 7/7`, and `Citation Thoroughness = 10/10`. This framework is valuable for debugging answer generation systems, ensuring they are not only relevant but also accurately and comprehensively grounded in their source material.
DECODING INTELLIGENCE...