## Heatmap: Heads Importance by Layer and Task
### Overview
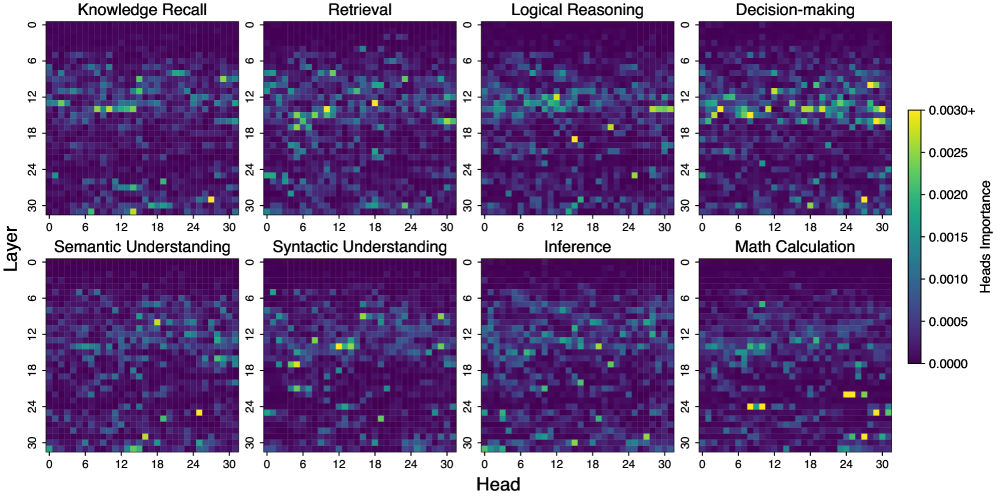
The image presents a series of heatmaps visualizing the importance of different "heads" within a neural network across various layers for different cognitive tasks. Each heatmap represents a specific task (Knowledge Recall, Retrieval, Logical Reasoning, Decision-making, Semantic Understanding, Syntactic Understanding, Inference, and Math Calculation). The x-axis represents the "Head" number (0-30), and the y-axis represents the "Layer" number (0-30). The color intensity indicates the "Heads Importance," ranging from dark purple (0.0000) to bright yellow (0.0030+).
### Components/Axes
* **Titles:** The heatmaps are titled with the cognitive tasks: Knowledge Recall, Retrieval, Logical Reasoning, Decision-making, Semantic Understanding, Syntactic Understanding, Inference, and Math Calculation.
* **X-axis:** Labeled "Head," with tick marks at intervals of 6, ranging from 0 to 30.
* **Y-axis:** Labeled "Layer," with tick marks at intervals of 6, ranging from 0 to 30.
* **Color Legend (Heads Importance):** Located on the right side of the image.
* Dark Purple: 0.0000
* Dark Blue: 0.0005
* Light Blue: 0.0010
* Green: 0.0015
* Yellow-Green: 0.0020
* Yellow: 0.0025
* Bright Yellow: 0.0030+
### Detailed Analysis
Each heatmap represents the importance of each head at each layer for a specific task. The color intensity indicates the level of importance.
* **Knowledge Recall:** Shows some higher importance heads concentrated around layers 12-18, with a few scattered high-importance heads in other layers.
* **Retrieval:** Similar to Knowledge Recall, with some concentration of higher importance heads around layers 12-18, and a few scattered elsewhere.
* **Logical Reasoning:** Shows a more dispersed pattern, with some higher importance heads scattered throughout the layers, but a slight concentration around layer 12.
* **Decision-making:** Shows a relatively even distribution of head importance across layers, with some slightly higher importance heads around layers 12-18.
* **Semantic Understanding:** Shows a few high-importance heads scattered throughout the layers, with no clear concentration.
* **Syntactic Understanding:** Shows a concentration of high-importance heads around layers 12-18, with a few scattered elsewhere.
* **Inference:** Shows a relatively even distribution of head importance across layers, with a few scattered high-importance heads.
* **Math Calculation:** Shows a concentration of high-importance heads in the lower layers (24-30), with a few scattered elsewhere.
### Key Observations
* **Layer 12-18 Importance:** Many tasks (Knowledge Recall, Retrieval, Syntactic Understanding, Decision-making) show a concentration of high-importance heads in the middle layers (around layers 12-18).
* **Math Calculation Anomaly:** Math Calculation stands out with a concentration of high-importance heads in the lower layers (24-30).
* **Sparse Activation:** The heatmaps are generally sparse, indicating that only a small subset of heads are highly important for each task at each layer.
### Interpretation
The heatmaps provide insights into which heads within a neural network are most important for different cognitive tasks at different layers. The concentration of high-importance heads in the middle layers (12-18) for many tasks suggests that these layers may be crucial for general cognitive processing. The unique pattern for Math Calculation, with high-importance heads in the lower layers, may indicate that this task relies on different processing mechanisms or representations compared to the other tasks. The sparsity of the heatmaps suggests that the network learns to use a specialized subset of heads for each task, rather than relying on all heads equally. This specialization could be a key factor in the network's ability to perform diverse cognitive tasks.