\n
## Line Chart: AIME-24 Accuracy vs Normalized (binned) Length of Thoughts
### Overview
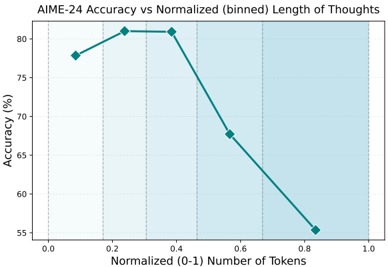
The image is a line chart plotting the accuracy percentage of a system or model (labeled "AIME-24") against a normalized measure of "Length of Thoughts," quantified as a binned number of tokens. The chart demonstrates a non-linear relationship where accuracy initially increases with thought length, peaks, and then declines sharply.
### Components/Axes
* **Chart Title:** "AIME-24 Accuracy vs Normalized (binned) Length of Thoughts"
* **Y-Axis (Vertical):**
* **Label:** "Accuracy (%)"
* **Scale:** Linear scale from 55 to 80.
* **Tick Marks:** Major ticks at 55, 60, 65, 70, 75, 80.
* **X-Axis (Horizontal):**
* **Label:** "Normalized (0-1) Number of Tokens"
* **Scale:** Linear scale from 0.0 to 1.0.
* **Tick Marks:** Major ticks at 0.0, 0.2, 0.4, 0.6, 0.8, 1.0.
* **Data Series:**
* A single data series is plotted as a solid teal line connecting diamond-shaped markers.
* **Legend:** No explicit legend is present within the chart area. The single line is implicitly the "AIME-24 Accuracy" series.
* **Chart Area:** The plot area has a light blue background with a faint white grid aligned with the major tick marks on both axes.
### Detailed Analysis
**Data Points (Approximate Values):**
The line connects five distinct data points. Values are estimated based on visual alignment with the grid.
1. **Point 1:** X ≈ 0.1, Y ≈ 78%
2. **Point 2:** X ≈ 0.25, Y ≈ 81% (Peak)
3. **Point 3:** X ≈ 0.4, Y ≈ 80.5%
4. **Point 4:** X ≈ 0.55, Y ≈ 67.5%
5. **Point 5:** X ≈ 0.85, Y ≈ 55.5%
**Trend Verification:**
* **Segment 1 (X=0.1 to X=0.25):** The line slopes upward, indicating increasing accuracy as normalized token length increases from a low value.
* **Segment 2 (X=0.25 to X=0.4):** The line is nearly flat with a very slight downward slope, indicating a plateau or peak in accuracy.
* **Segment 3 (X=0.4 to X=0.55):** The line slopes steeply downward, indicating a significant drop in accuracy.
* **Segment 4 (X=0.55 to X=0.85):** The line continues to slope downward at a similar steep rate, indicating a continued and severe decline in accuracy for longer thought lengths.
### Key Observations
1. **Optimal Range:** The highest accuracy (≈81%) is achieved within a normalized token length range of approximately 0.25 to 0.4.
2. **Sharp Decline:** There is a pronounced and rapid decrease in accuracy for normalized token lengths greater than 0.4. The accuracy drops by approximately 25 percentage points (from ~80.5% to ~55.5%) as the normalized length increases from 0.4 to 0.85.
3. **Initial Benefit:** Very short thought lengths (normalized value ~0.1) yield lower accuracy (~78%) than the peak, suggesting some minimum length is beneficial.
4. **Monotonic Decrease Post-Peak:** After the peak at ~0.25, the relationship is strictly decreasing; there is no recovery in accuracy at higher token lengths within the plotted range.
### Interpretation
The chart suggests a strong, non-monotonic relationship between the length of a model's "thought" process (measured in normalized tokens) and its final accuracy on the AIME-24 task.
* **The "Goldilocks Zone":** The data indicates an optimal intermediate length for reasoning or generation. Thoughts that are too short may lack sufficient depth or information processing, leading to sub-optimal accuracy. Thoughts that are excessively long become detrimental, potentially due to introducing noise, losing coherence, or propagating errors through a lengthy chain of reasoning.
* **Performance Cliff:** The steep decline after the peak is the most critical feature. It implies that beyond a certain point, allowing or forcing a model to generate more tokens actively harms performance. This is a crucial insight for designing inference strategies or training objectives—simply maximizing output length is counterproductive.
* **Implication for AIME-24:** For the specific task or benchmark "AIME-24," the results argue for constraining or optimizing the model's reasoning length to fall within the 0.25-0.4 normalized range to maximize accuracy. The chart provides a quantitative basis for such a design choice.
* **Normalized Scale:** The use of a normalized (0-1) scale for token count suggests the underlying raw token counts may vary across problems or samples, and this normalization allows for a consistent comparison of relative length. The absolute token counts corresponding to 0.25 or 0.4 are not provided in the chart.