## Line Graph: AIME-24 Accuracy vs Normalized (binned) Length of Thoughts
### Overview
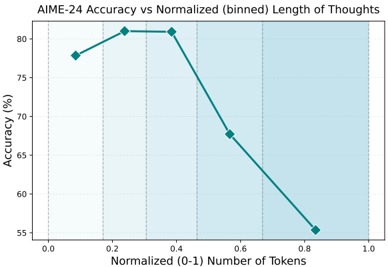
The image is a line graph depicting the relationship between normalized token length (0-1) and AIME-24 accuracy (%). The graph shows a single teal line with diamond markers, a light blue shaded area beneath the line, and vertical dashed lines dividing the x-axis into bins. Accuracy decreases as token length increases beyond a critical point.
### Components/Axes
- **Title**: "AIME-24 Accuracy vs Normalized (binned) Length of Thoughts"
- **X-axis**: "Normalized (0-1) Number of Tokens" (ranges from 0.0 to 1.0 in increments of 0.2)
- **Y-axis**: "Accuracy (%)" (ranges from 55% to 80% in increments of 5%)
- **Legend**: Not explicitly labeled, but the teal line with diamond markers represents the primary data series.
- **Shaded Area**: Light blue region beneath the line, likely indicating confidence intervals or variability.
- **Dashed Lines**: Vertical lines at x = 0.2, 0.4, 0.6, 0.8, dividing the x-axis into bins.
### Detailed Analysis
- **Data Points**:
- At x = 0.1 (normalized tokens), accuracy ≈ 78%.
- At x = 0.3, accuracy peaks at ≈ 81%.
- At x = 0.5, accuracy drops to ≈ 68%.
- At x = 0.9, accuracy reaches ≈ 55%.
- **Trends**:
- The line slopes upward from x = 0.0 to x = 0.3, then sharply declines from x = 0.3 to x = 1.0.
- The shaded area remains consistent in width, suggesting uniform variability across token lengths.
### Key Observations
1. **Peak Accuracy**: Maximum accuracy (81%) occurs at x = 0.3 tokens, indicating optimal performance at moderate thought length.
2. **Decline Beyond Optimal**: Accuracy drops by 26 percentage points (from 81% to 55%) as token length increases beyond 0.3.
3. **Bin Structure**: The vertical dashed lines suggest the data is binned into intervals of 0.2 tokens, with the most significant drop occurring between 0.4 and 0.6 tokens.
### Interpretation
The data suggests a non-linear relationship between thought length and accuracy. Shorter thoughts (up to 0.3 tokens) yield higher accuracy, likely due to reduced complexity or noise. Beyond this threshold, longer thoughts may introduce irrelevant information or overcomplication, degrading performance. The shaded area implies variability in results, but the consistent width suggests this variability is stable across token lengths. The absence of a legend limits interpretation of the line's identity, but the teal color and diamond markers are unique to this dataset. This pattern highlights the importance of balancing thought length to avoid diminishing returns in accuracy.