## Line Chart: Norm vs Layer for Different Association Types
### Overview
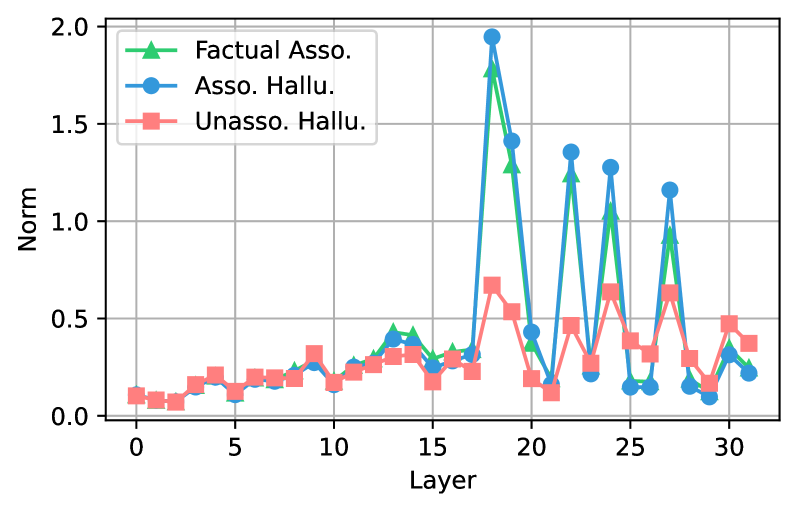
The image is a line chart comparing the "Norm" values across different "Layers" for three categories: "Factual Asso.", "Asso. Hallu.", and "Unasso. Hallu.". The x-axis represents the layer number, ranging from 0 to 30. The y-axis represents the Norm value, ranging from 0.0 to 2.0. The chart displays how the norm changes across layers for each of the three association types.
### Components/Axes
* **X-axis:** "Layer", with ticks at 0, 5, 10, 15, 20, 25, and 30.
* **Y-axis:** "Norm", with ticks at 0.0, 0.5, 1.0, 1.5, and 2.0.
* **Legend (Top-Left):**
* Green Triangle: "Factual Asso."
* Blue Circle: "Asso. Hallu."
* Red Square: "Unasso. Hallu."
### Detailed Analysis
* **Factual Asso. (Green Triangle):**
* Trend: Relatively low and stable until layer 15, then increases to a peak around layer 19, then decreases and oscillates.
* Approximate Values:
* Layer 0-15: ~0.1 to 0.4
* Layer 19: ~1.8
* Layer 22: ~0.4
* Layer 27: ~1.0
* Layer 30: ~0.2
* **Asso. Hallu. (Blue Circle):**
* Trend: Similar to "Factual Asso.", but with more pronounced peaks and valleys.
* Approximate Values:
* Layer 0-15: ~0.1 to 0.4
* Layer 19: ~1.95
* Layer 22: ~0.1
* Layer 25: ~1.3
* Layer 27: ~0.15
* Layer 30: ~0.1
* **Unasso. Hallu. (Red Square):**
* Trend: Generally lower than the other two lines, with less pronounced peaks.
* Approximate Values:
* Layer 0-15: ~0.1 to 0.4
* Layer 19: ~0.7
* Layer 22: ~0.1
* Layer 25: ~0.5
* Layer 27: ~0.3
* Layer 30: ~0.4
### Key Observations
* The "Factual Asso." and "Asso. Hallu." lines show similar patterns, with peaks around the same layer numbers.
* The "Unasso. Hallu." line generally has lower norm values compared to the other two.
* All three lines converge to similar values in the initial layers (0-15).
* The greatest divergence between the lines occurs between layers 18 and 28.
### Interpretation
The chart suggests that "Factual Asso." and "Asso. Hallu." have similar norm characteristics across the layers, indicating a potential relationship or shared behavior. "Unasso. Hallu." exhibits a different pattern, with lower norm values, suggesting it might be distinct from the other two categories. The peaks in "Factual Asso." and "Asso. Hallu." could indicate specific layers where these associations are more prominent or have a greater impact on the overall norm. The convergence of all three lines in the initial layers might indicate a common baseline or initial state before the associations diverge.