# Technical Document Extraction: Layer-wise Norm Analysis
## 1. Image Overview
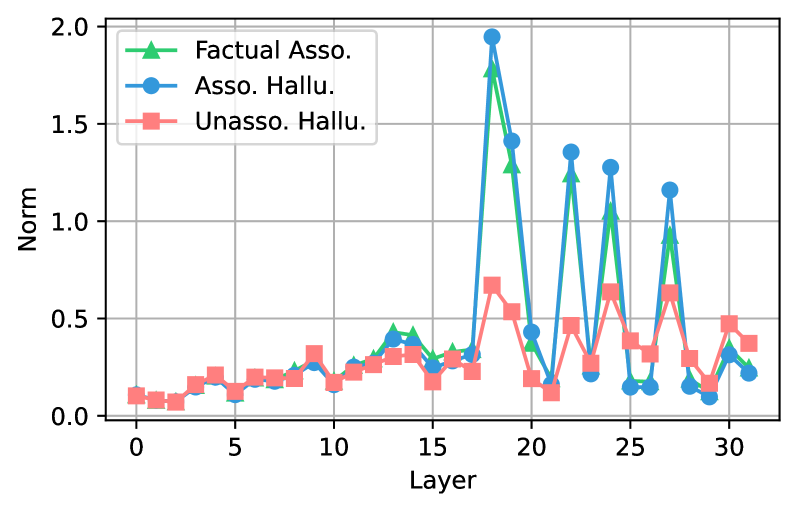
This image is a line graph illustrating the relationship between neural network layers and a "Norm" metric across three distinct categories of data. The chart uses a coordinate grid system with markers to denote specific data points.
## 2. Component Isolation
### Header / Legend
* **Location:** Top-left quadrant (approximate [x, y] coordinates: [0.05, 0.95] relative to the plot area).
* **Legend Items:**
* **Green Line with Triangle Markers ($\blacktriangle$):** "Factual Asso."
* **Blue Line with Circle Markers ($\bullet$):** "Asso. Hallu."
* **Red Line with Square Markers ($\blacksquare$):** "Unasso. Hallu."
### Main Chart Area
* **X-Axis Label:** "Layer"
* **X-Axis Scale:** 0 to 32 (increments marked every 5 units: 0, 5, 10, 15, 20, 25, 30).
* **Y-Axis Label:** "Norm"
* **Y-Axis Scale:** 0.0 to 2.0 (increments marked every 0.5 units: 0.0, 0.5, 1.0, 1.5, 2.0).
* **Grid:** Major grid lines are present for both X and Y axes.
---
## 3. Data Series Analysis and Trend Verification
### Series 1: Factual Asso. (Green, Triangles)
* **Trend Description:** This series remains relatively flat and low (below 0.5) from Layer 0 to Layer 17. At Layer 18, it exhibits a massive spike, followed by a series of high-amplitude oscillations between Layers 18 and 32.
* **Key Data Points (Approximate):**
| Layer | Norm (Approx.) |
| :--- | :--- |
| 0–17 | 0.1 – 0.4 |
| 18 | 1.8 |
| 20 | 0.4 |
| 22 | 1.25 |
| 24 | 1.1 |
| 27 | 1.0 |
### Series 2: Asso. Hallu. (Blue, Circles)
* **Trend Description:** This series tracks very closely with "Factual Asso." throughout the entire range. It remains low until Layer 17, then experiences the highest peaks in the graph starting at Layer 18.
* **Key Data Points (Approximate):**
| Layer | Norm (Approx.) |
| :--- | :--- |
| 0–17 | 0.1 – 0.4 |
| 18 | 1.95 |
| 19 | 1.4 |
| 22 | 1.35 |
| 24 | 1.3 |
| 27 | 1.15 |
### Series 3: Unasso. Hallu. (Red, Squares)
* **Trend Description:** This series shows much lower variance than the other two. While it also experiences a rise in activity after Layer 17, the magnitude of its peaks is significantly dampened compared to the "Associated" categories.
* **Key Data Points (Approximate):**
| Layer | Norm (Approx.) |
| :--- | :--- |
| 0–17 | 0.1 – 0.3 |
| 18 | 0.65 |
| 24 | 0.65 |
| 27 | 0.65 |
| General | Rarely exceeds 0.7 |
---
## 4. Comparative Observations
* **Phase Shift:** There is a clear behavioral shift in the model after **Layer 17**. Prior to this, all three categories behave similarly with low Norm values.
* **Association Correlation:** The "Factual Asso." (Green) and "Asso. Hallu." (Blue) series are highly correlated, often peaking and dipping at the same layers with similar magnitudes.
* **Unassociated Divergence:** The "Unasso. Hallu." (Red) series diverges significantly from the other two in the latter half of the network (Layers 18–32), maintaining a much lower Norm profile despite following a similar oscillatory pattern.
* **Peak Layers:** Layers 18, 22, 24, and 27 represent significant "spikes" in Norm values for all categories, though the intensity varies by category.