## Line Chart: Hallucination Norms vs. Layer
### Overview
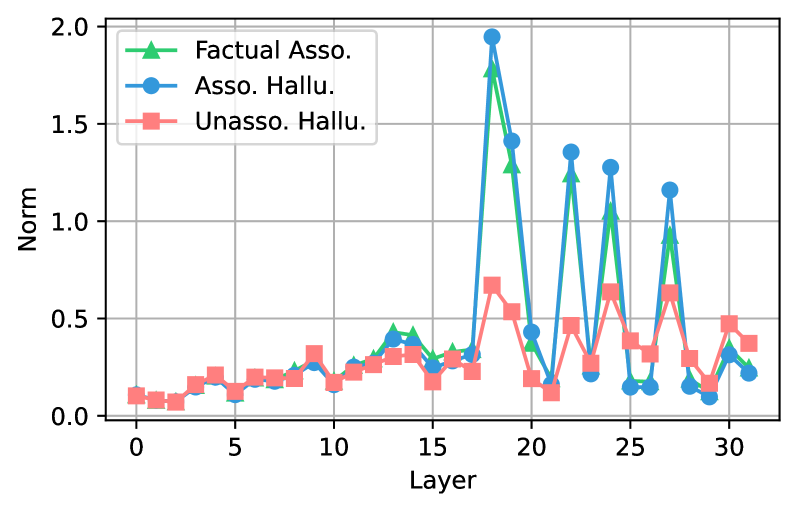
This image presents a line chart illustrating the relationship between the layer number in a model and the normalized values ("Norm") for three different types of hallucinations: "Factual Asso." (Factual Association), "Asso. Hallu." (Associative Hallucination), and "Unasso. Hallu." (Unassociated Hallucination). The chart spans layer numbers from 0 to approximately 32.
### Components/Axes
* **X-axis:** "Layer" - ranging from 0 to 32, with tick marks at integer values.
* **Y-axis:** "Norm" - ranging from 0.0 to 2.0, with tick marks at 0.5 intervals.
* **Legend:** Located in the top-left corner, identifying the three data series:
* "Factual Asso." - represented by a green line with triangle markers.
* "Asso. Hallu." - represented by a blue line with circle markers.
* "Unasso. Hallu." - represented by a red line with square markers.
* **Gridlines:** Horizontal gridlines are present to aid in reading values.
### Detailed Analysis
**Factual Asso. (Green Line):** This line generally remains below 0.5 until approximately layer 16. From layer 16 to 20, it exhibits a steep upward trend, peaking at approximately 1.7 at layer 19. It then declines rapidly, oscillating between 0.5 and 1.0 from layer 20 to 32.
* Layer 0: ~0.15
* Layer 5: ~0.25
* Layer 10: ~0.3
* Layer 15: ~0.4
* Layer 16: ~0.5
* Layer 17: ~0.8
* Layer 18: ~1.3
* Layer 19: ~1.7
* Layer 20: ~0.8
* Layer 25: ~0.7
* Layer 30: ~0.4
**Asso. Hallu. (Blue Line):** This line starts at approximately 0.1 at layer 0 and remains relatively low until layer 18, where it begins to increase. It peaks at approximately 1.2 at layer 22, then declines, oscillating between 0.5 and 1.0 from layer 22 to 32.
* Layer 0: ~0.1
* Layer 5: ~0.15
* Layer 10: ~0.2
* Layer 15: ~0.25
* Layer 18: ~0.4
* Layer 20: ~0.7
* Layer 22: ~1.2
* Layer 25: ~0.8
* Layer 30: ~0.5
**Unasso. Hallu. (Red Line):** This line remains consistently below 0.5 throughout the entire range of layers. It exhibits a slight upward trend from layer 0 to 15, reaching approximately 0.4. It then plateaus and fluctuates around 0.5 from layer 15 to 32.
* Layer 0: ~0.1
* Layer 5: ~0.2
* Layer 10: ~0.3
* Layer 15: ~0.4
* Layer 20: ~0.5
* Layer 25: ~0.3
* Layer 30: ~0.5
### Key Observations
* "Factual Asso." exhibits the most significant fluctuations, with a pronounced peak around layer 19.
* "Asso. Hallu." shows a delayed increase compared to "Factual Asso.", peaking around layer 22.
* "Unasso. Hallu." remains relatively stable and at a lower level compared to the other two types of hallucinations.
* All three hallucination types show some degree of increase as the layer number increases, suggesting that deeper layers of the model are more prone to generating hallucinations.
### Interpretation
The chart suggests that the propensity for different types of hallucinations varies across the layers of the model. "Factual Association" hallucinations appear earlier and are more pronounced than "Associative Hallucinations." "Unassociated Hallucinations" are consistently the least frequent. The peaks in "Factual Asso." and "Asso. Hallu." around layers 19 and 22, respectively, could indicate critical points in the model's processing where it is more susceptible to generating incorrect or misleading information. The overall trend of increasing hallucination rates with layer depth suggests that the model's confidence in its predictions may decrease as it processes more complex information. This could be due to the model overfitting to the training data or encountering ambiguous inputs. The differences between the hallucination types suggest that different mechanisms may be responsible for generating each type of error. Further investigation is needed to understand the underlying causes of these patterns and to develop strategies for mitigating hallucinations in the model.