## Line Graph: Normalized Metrics Across Layers
### Overview
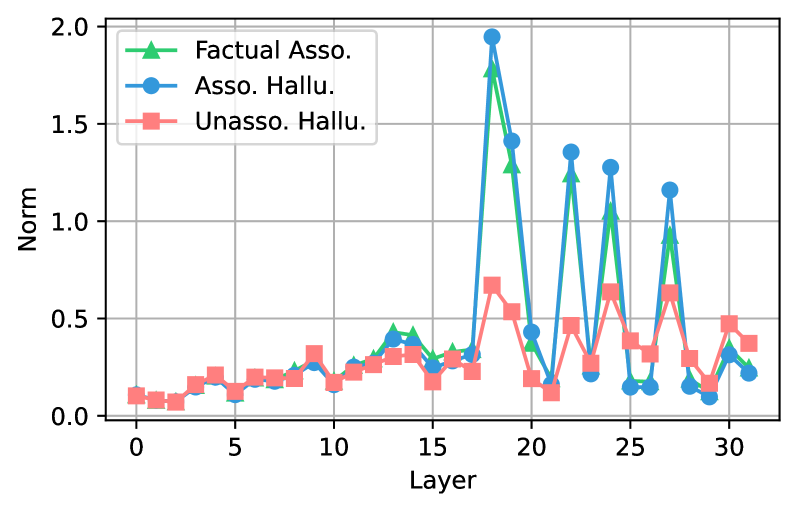
The image is a line graph depicting normalized values (0-2.0) of three metrics—Factual Association, Associated Hallucination, and Unassociated Hallucination—across 31 layers (0-30). The graph uses distinct markers (green triangles, blue circles, red squares) to differentiate the series, with a legend in the top-left corner.
### Components/Axes
- **X-axis (Layer)**: Ranges from 0 to 30 in increments of 5.
- **Y-axis (Norm)**: Normalized values from 0.0 to 2.0 in increments of 0.5.
- **Legend**: Top-left corner, with:
- Green triangles: Factual Association
- Blue circles: Associated Hallucination
- Red squares: Unassociated Hallucination
### Detailed Analysis
1. **Factual Association (Green)**:
- Starts near 0.0 at layer 0, gradually increasing to ~0.4 by layer 15.
- Peaks at ~1.8 near layer 18, then declines to ~0.3 by layer 30.
- Shows secondary peaks at layers 22 (~1.2) and 27 (~0.9).
2. **Associated Hallucination (Blue)**:
- Remains near 0.0 until layer 15, then spikes to ~2.0 at layer 18.
- Drops to ~1.4 at layer 20, rises again to ~1.3 at layer 22, and declines to ~0.1 by layer 30.
- Exhibits volatility, with sharp rises and falls.
3. **Unassociated Hallucination (Red)**:
- Stays consistently low (~0.1-0.3) until layer 15.
- Peaks at ~0.6 near layer 18, then fluctuates between 0.3-0.5 until layer 30.
- Shows a secondary peak at layer 27 (~0.6).
### Key Observations
- **Associated Hallucination (Blue)** exhibits the most dramatic spikes, particularly at layers 18 and 22, reaching the maximum normalized value (~2.0).
- **Factual Association (Green)** closely follows the peaks of the blue series but with slightly lower magnitudes.
- **Unassociated Hallucination (Red)** remains the most stable, with smaller, less frequent peaks.
- All series decline after layer 25, with blue dropping most sharply.
### Interpretation
The data suggests a strong correlation between **Factual Association** and **Associated Hallucination**, as their peaks align closely (e.g., layers 18, 22). The **Unassociated Hallucination** metric remains relatively stable, indicating it is less influenced by layer-specific variations. The sharp spikes in the blue series may reflect critical layers where model behavior or data processing undergoes significant changes. The decline after layer 25 could imply diminishing returns or stabilization in later layers. The red series’ consistency might highlight a baseline level of unassociated hallucinations unaffected by layer dynamics.