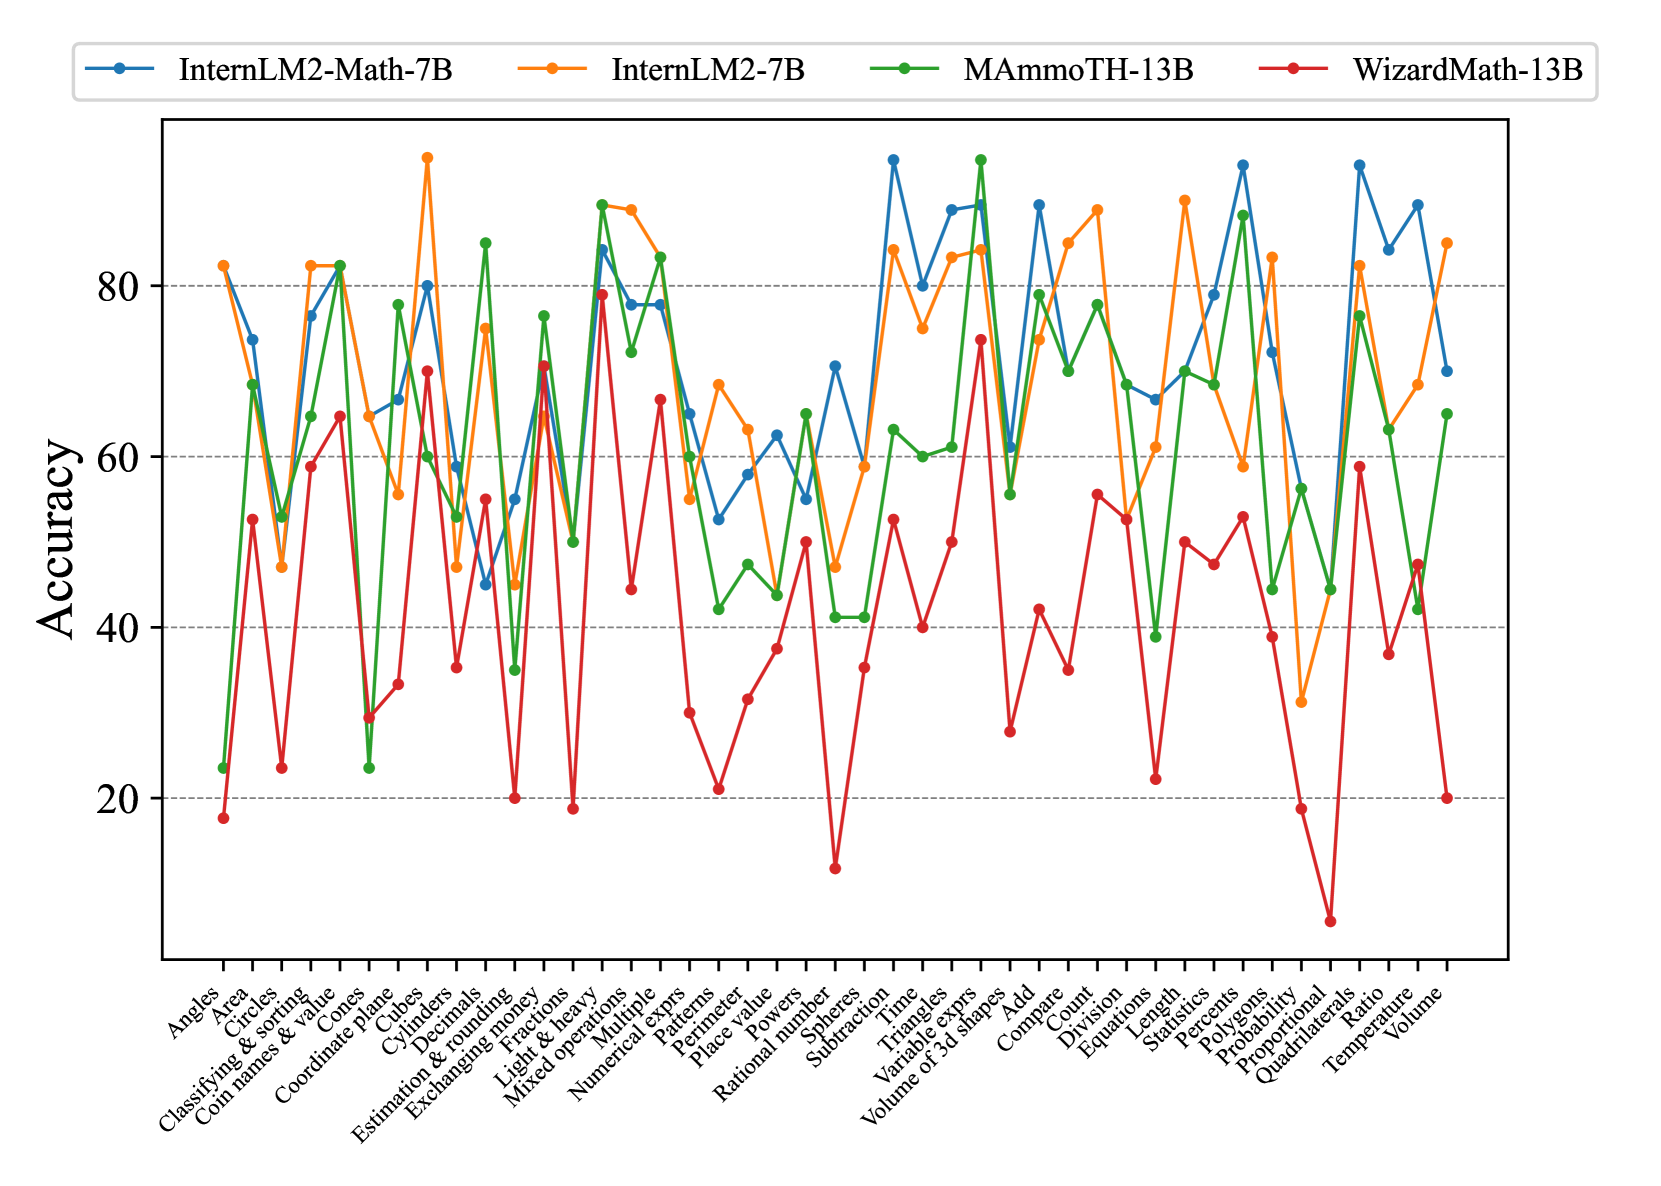
## Line Graph: Accuracy of Different Math Models Across Various Topics
### Overview
The image is a line graph comparing the accuracy of four mathematical models (InternLM2-Math-7B, InternLM2-7B, MAmmoTH-13B, and WizardMath-13B) across 30 distinct math topics. Accuracy is measured on a y-axis (0–100%), while the x-axis lists topics like "Angles," "Area," "Classifying & sorting," and "Volume." The graph shows significant variability in performance across models and topics.
---
### Components/Axes
- **Legend**: Located at the top, with four entries:
- **Blue (solid line with circles)**: InternLM2-Math-7B
- **Orange (dashed line with squares)**: InternLM2-7B
- **Green (solid line with triangles)**: MAmmoTH-13B
- **Red (dashed line with diamonds)**: WizardMath-13B
- **X-axis**: Labeled "Accuracy" with topics listed sequentially (e.g., "Angles," "Area," "Classifying & sorting," ..., "Volume").
- **Y-axis**: Labeled "Accuracy" with increments of 20 (0–100%).
---
### Detailed Analysis
1. **InternLM2-Math-7B (Blue)**:
- Starts at ~80% for "Angles," dips to ~60% for "Area," and fluctuates between 50–90%.
- Peaks at ~90% for "Cylinders" and "Estimation & rounding."
- Ends at ~70% for "Volume."
2. **InternLM2-7B (Orange)**:
- Begins at ~80% for "Angles," drops to ~40% for "Area," and oscillates between 40–90%.
- Peaks at ~95% for "Cylinders" and "Estimation & rounding."
- Ends at ~85% for "Volume."
3. **MAmmoTH-13B (Green)**:
- Starts at ~20% for "Angles," rises to ~80% for "Area," and stabilizes between 60–85%.
- Peaks at ~90% for "Light & heavy" and "Mixed operations."
- Ends at ~65% for "Volume."
4. **WizardMath-13B (Red)**:
- Begins at ~20% for "Angles," spikes to ~60% for "Area," and fluctuates wildly between 10–70%.
- Sharp drops to ~10% for "Subtraction" and "Proportionality."
- Ends at ~20% for "Volume."
---
### Key Observations
- **WizardMath-13B (Red)** exhibits the most erratic performance, with extreme lows (e.g., ~10% for "Subtraction") and highs (~70% for "Area").
- **InternLM2-Math-7B (Blue)** and **InternLM2-7B (Orange)** show similar trends but with InternLM2-7B achieving higher peaks (e.g., ~95% for "Cylinders").
- **MAmmoTH-13B (Green)** demonstrates relative stability, with fewer extreme dips compared to other models.
- **Lowest Performance**: WizardMath-13B underperforms in "Subtraction" (~10%) and "Proportionality" (~15%).
- **Highest Performance**: InternLM2-7B excels in "Cylinders" (~95%) and "Estimation & rounding" (~90%).
---
### Interpretation
The data suggests that model performance varies significantly by topic and architecture:
1. **Model Size vs. Performance**: Larger models (e.g., MAmmoTH-13B, WizardMath-13B) do not consistently outperform smaller models (e.g., InternLM2-7B) across all topics.
2. **Topic-Specific Strengths**:
- InternLM2-7B excels in geometry-related topics ("Cylinders," "Estimation & rounding").
- WizardMath-13B struggles with arithmetic operations ("Subtraction," "Proportionality").
3. **Stability**: MAmmoTH-13B shows the least variability, suggesting robustness in handling diverse topics.
4. **Anomalies**: WizardMath-13B’s extreme lows (e.g., ~10% for "Subtraction") indicate potential weaknesses in specific problem types.
The graph highlights the importance of model specialization and the need for targeted improvements in underperforming areas.