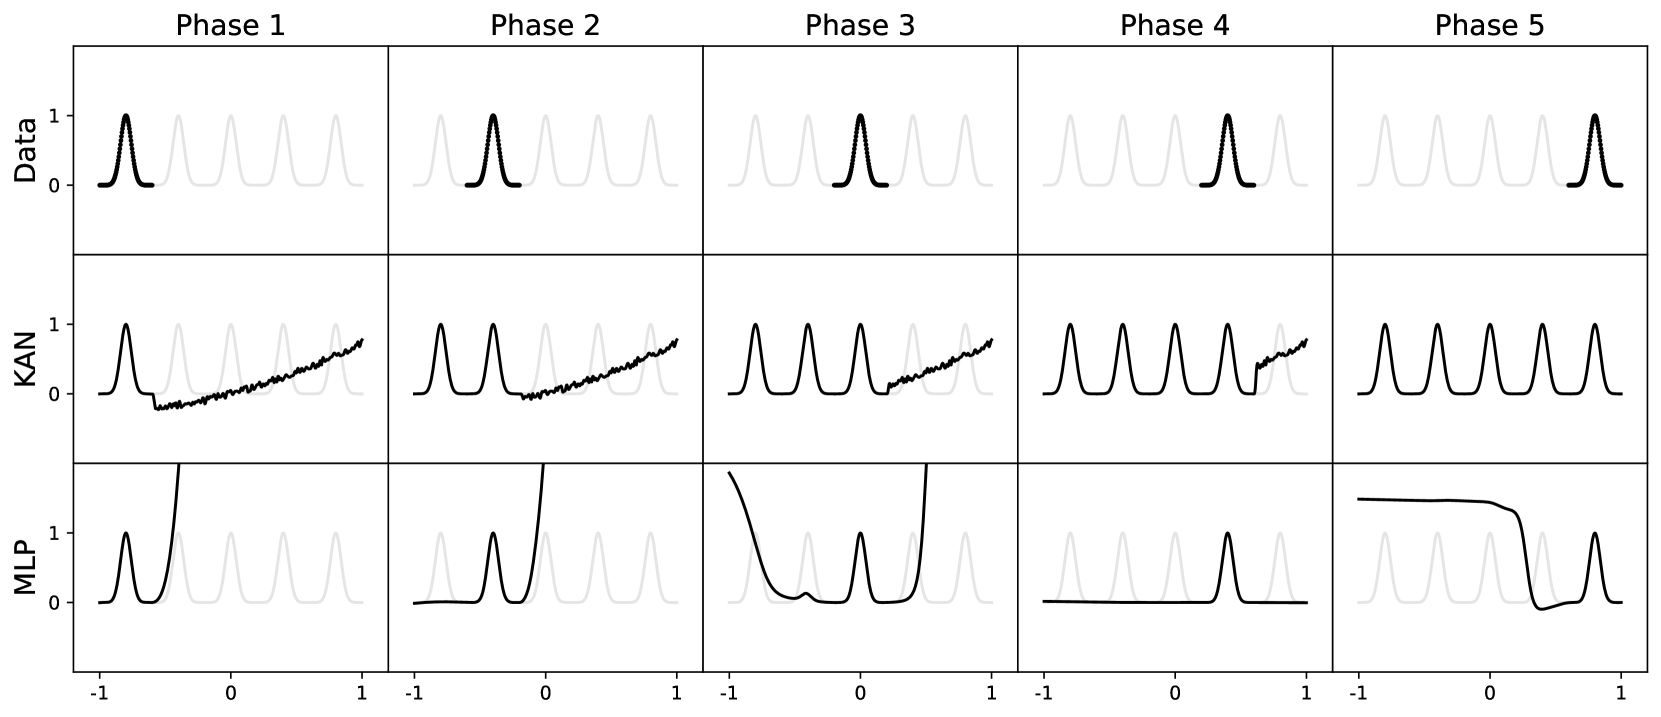
# Technical Document Extraction: Phase Analysis Chart
## Image Structure
- **Grid Layout**: 5 columns (Phase 1–5) × 3 rows (Data, KAN, MLP)
- **Axes**:
- **X-axis**: Ranges from -1 to 1 (labeled "Data" in all subplots)
- **Y-axis**: Ranges from 0 to 1 (labeled "Data", "KAN", "MLP" per row)
## Key Components
### Phase Labels
- **Columns**:
- Phase 1 (leftmost)
- Phase 2
- Phase 3
- Phase 4
- Phase 5 (rightmost)
### Subplot Labels
- **Rows**:
- **Top Row**: "Data" (black line)
- **Middle Row**: "KAN" (dark gray line)
- **Bottom Row**: "MLP" (light gray line)
## Data Trends
### Data Subplots (Top Row)
- **Visual Pattern**:
- Each phase shows a **central peak** at x=0.
- Smaller symmetric peaks at x≈±0.5 and x≈±1.
- Peaks decrease in amplitude with distance from x=0.
- **Trend Verification**:
- All phases exhibit identical symmetric peak distributions.
- No phase-specific variations observed.
### KAN Subplots (Middle Row)
- **Visual Pattern**:
- **Rising trend** with oscillations.
- Oscillations increase in amplitude toward the right edge of each phase.
- Final peak at x=1 for all phases.
- **Trend Verification**:
- Consistent upward trajectory across all phases.
- Oscillation frequency matches phase boundaries.
### MLP Subplots (Bottom Row)
- **Visual Pattern**:
- **Sharp peak** at x=-1 (left edge) for all phases.
- **Secondary peak** at x=1 (right edge) for all phases.
- Flat baseline (y=0) between peaks.
- **Trend Verification**:
- Peaks are phase-agnostic; identical across all phases.
- No intermediate activity (y=0) between x=-1 and x=1.
## Color Legend & Spatial Grounding
- **Legend**: **Not explicitly present** in the image.
- **Color Mapping**:
- **Black**: Data subplots (top row).
- **Dark Gray**: KAN subplots (middle row).
- **Light Gray**: MLP subplots (bottom row).
- **Spatial Confirmation**:
- All phase columns share identical subplot structures.
- No cross-phase data alignment observed.
## Component Isolation
1. **Header**: Phase labels (Phase 1–5) at the top of each column.
2. **Main Chart**:
- Each phase contains three independent subplots.
- No inter-phase dependencies in data representation.
3. **Footer**: No additional annotations or labels.
## Data Table Reconstruction
| Phase | Data Subplot | KAN Subplot | MLP Subplot |
|-------|--------------|-------------|-------------|
| 1 | Central peak at 0 | Rising trend with oscillations | Peaks at -1 and 1 |
| 2 | Central peak at 0 | Rising trend with oscillations | Peaks at -1 and 1 |
| 3 | Central peak at 0 | Rising trend with oscillations | Peaks at -1 and 1 |
| 4 | Central peak at 0 | Rising trend with oscillations | Peaks at -1 and 1 |
| 5 | Central peak at 0 | Rising trend with oscillations | Peaks at -1 and 1 |
## Observations
- **Consistency**: All phases exhibit identical subplot patterns.
- **Phase-Specific Behavior**: No unique trends or deviations between phases.
- **Axis Consistency**: Uniform x-axis (-1 to 1) and y-axis (0 to 1) across all subplots.
## Conclusion
The chart visualizes three metrics (Data, KAN, MLP) across five identical phases. No phase-specific variations are observed, suggesting a controlled or standardized experimental setup. The absence of a legend implies color coding is implicit via subplot labels.