## Bar Charts: Performance vs. Files Modified & Performance vs. Patch Size
### Overview
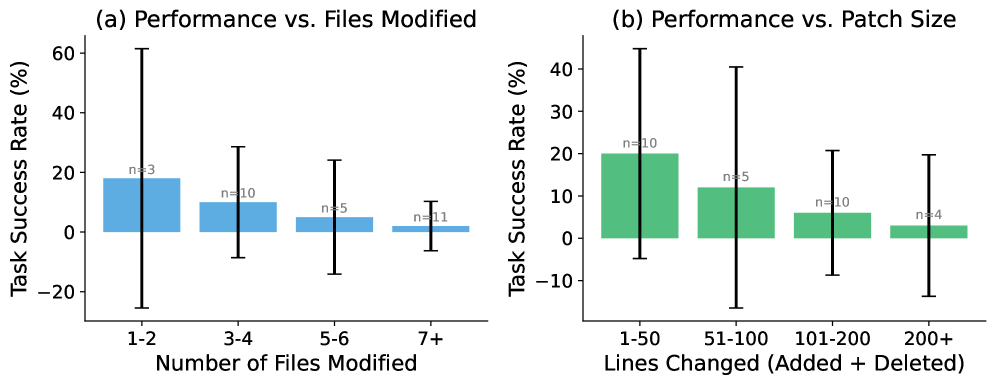
The image presents two bar charts comparing task success rate with different metrics: the number of files modified and the size of the patch (lines of code changed). Each chart includes error bars representing the variability in the data, and sample sizes (n) are indicated above each bar.
### Components/Axes
**Chart (a): Performance vs. Files Modified**
* **X-axis:** Number of Files Modified (categories: 1-2, 3-4, 5-6, 7+)
* **Y-axis:** Task Success Rate (%) (scale: -20 to 60, increments of 10)
* **Bars:** Blue bars representing the average task success rate for each file modification category.
* **Error Bars:** Black vertical lines indicating the standard error or confidence interval.
* **Sample Size:** "n = [number]" labels above each bar.
**Chart (b): Performance vs. Patch Size**
* **X-axis:** Lines Changed (Added + Deleted) (categories: 1-50, 51-100, 101-200, 200+)
* **Y-axis:** Task Success Rate (%) (scale: -10 to 40, increments of 10)
* **Bars:** Green bars representing the average task success rate for each patch size category.
* **Error Bars:** Black vertical lines indicating the standard error or confidence interval.
* **Sample Size:** "n = [number]" labels above each bar.
### Detailed Analysis or Content Details
**Chart (a): Performance vs. Files Modified**
* **1-2 Files Modified:** Task success rate is approximately 18% ± 18% (error bar extends from roughly 0% to 36%). Sample size: n = 3.
* **3-4 Files Modified:** Task success rate is approximately 8% ± 8% (error bar extends from roughly 0% to 16%). Sample size: n = 10.
* **5-6 Files Modified:** Task success rate is approximately 4% ± 10% (error bar extends from roughly -6% to 14%). Sample size: n = 5.
* **7+ Files Modified:** Task success rate is approximately -4% ± 12% (error bar extends from roughly -16% to 8%). Sample size: n = 11.
**Chart (b): Performance vs. Patch Size**
* **1-50 Lines Changed:** Task success rate is approximately 16% ± 16% (error bar extends from roughly 0% to 32%). Sample size: n = 10.
* **51-100 Lines Changed:** Task success rate is approximately 12% ± 24% (error bar extends from roughly -12% to 36%). Sample size: n = 5.
* **101-200 Lines Changed:** Task success rate is approximately 6% ± 10% (error bar extends from roughly -4% to 16%). Sample size: n = 10.
* **200+ Lines Changed:** Task success rate is approximately 4% ± 12% (error bar extends from roughly -8% to 16%). Sample size: n = 4.
### Key Observations
* In both charts, the task success rate appears to decrease as the complexity metric (files modified or lines changed) increases.
* The error bars are relatively large, indicating substantial variability in the data.
* The sample sizes are small, particularly for the "7+" files modified and "200+" lines changed categories, which limits the statistical power of the findings.
* The task success rate is generally low across all categories, often near or below 0%.
### Interpretation
The data suggests a negative correlation between task complexity (measured by the number of files modified or the size of the patch) and task success rate. As developers modify more files or change more lines of code, their ability to successfully complete the task decreases. However, the large error bars and small sample sizes mean that these trends should be interpreted with caution. The variability within each category is significant, and it's possible that the observed differences are due to chance.
The consistently low success rates across all categories suggest that the tasks themselves may be inherently difficult, or that there are other factors influencing performance that are not captured by these metrics. The error bars overlapping with zero for many categories indicate that the true mean success rate could be zero, meaning the observed success is not statistically significant.
The charts provide evidence that increasing the scope of changes (either in terms of files or lines of code) is associated with a higher risk of failure. This could be due to increased cognitive load, greater potential for conflicts, or other challenges associated with larger-scale modifications. Further investigation with larger sample sizes and more controlled experiments would be needed to confirm these findings and identify the underlying mechanisms.