## Box Plots: Task Success Rate vs. Files Modified and Patch Size
### Overview
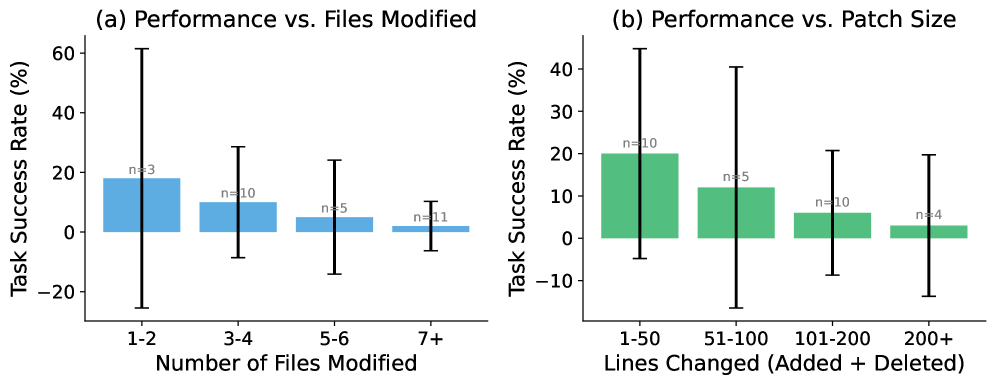
The image contains two side-by-side box plots comparing task success rates under different conditions. Plot (a) examines the relationship between task success rate and the number of files modified, while plot (b) analyzes the relationship between task success rate and patch size (lines changed). Both plots use box plots to visualize distributions, with error bars indicating variability.
---
### Components/Axes
#### Plot (a): Performance vs. Files Modified
- **X-axis**: Number of Files Modified (categories: "1-2", "3-4", "5-6", "7+")
- **Y-axis**: Task Success Rate (%) (range: -20% to 60%)
- **Legend**: No explicit legend; colors differentiate plots (blue for plot (a), green for plot (b)).
- **Sample Sizes**:
- "1-2": n=3
- "3-4": n=10
- "5-6": n=5
- "7+": n=11
#### Plot (b): Performance vs. Patch Size
- **X-axis**: Lines Changed (categories: "1-50", "51-100", "101-200", "200+")
- **Y-axis**: Task Success Rate (%) (range: -10% to 40%)
- **Sample Sizes**:
- "1-50": n=10
- "51-100": n=5
- "101-200": n=10
- "200+": n=4
---
### Detailed Analysis
#### Plot (a): Performance vs. Files Modified
- **1-2 files**: Median success rate ~20% (n=3). Error bar spans ~-10% to 50%.
- **3-4 files**: Median ~10% (n=10). Error bar spans ~-15% to 30%.
- **5-6 files**: Median ~5% (n=5). Error bar spans ~-20% to 25%.
- **7+ files**: Median ~0% (n=11). Error bar spans ~-25% to 15%.
#### Plot (b): Performance vs. Patch Size
- **1-50 lines**: Median ~20% (n=10). Error bar spans ~-5% to 40%.
- **51-100 lines**: Median ~15% (n=5). Error bar spans ~-10% to 30%.
- **101-200 lines**: Median ~8% (n=10). Error bar spans ~-15% to 25%.
- **200+ lines**: Median ~3% (n=4). Error bar spans ~-20% to 20%.
---
### Key Observations
1. **Negative Correlation**: In both plots, task success rate decreases as the number of files modified or lines changed increases.
2. **Variability**: Larger categories (e.g., "7+" files, "200+" lines) show wider error bars, indicating higher variability in success rates.
3. **Sample Size Impact**: Smaller sample sizes (e.g., n=3 for "1-2 files") have less precise error bars, suggesting lower confidence in measurements.
4. **Outliers**: No explicit outliers, but the "7+" files category in plot (a) has a notably low median (~0%) compared to other groups.
---
### Interpretation
The data suggests that task complexity (measured by files modified or lines changed) negatively impacts success rates. Larger modifications or patches correlate with lower performance, likely due to increased cognitive load or error-proneness. The variability in success rates for larger categories highlights the need for further investigation into factors like user expertise or tooling support. The small sample sizes in some categories (e.g., n=4 for "200+" lines) limit statistical robustness, emphasizing the importance of larger datasets for conclusive insights.