TECHNICAL ASSET FINGERPRINT
e0240f904cf66f9e5be8e241
Click to view fullscreen
Press ESC or click to close
FOUND IN PAPERS
EXPERT: gemini-2.0-flash VERSION 1
RUNTIME: nugit/gemini/gemini-2.0-flash
INTEL_VERIFIED
## Chart Type: Multiple Plots Comparing Loudspeaker Layouts and Panning Sensitivity
### Overview
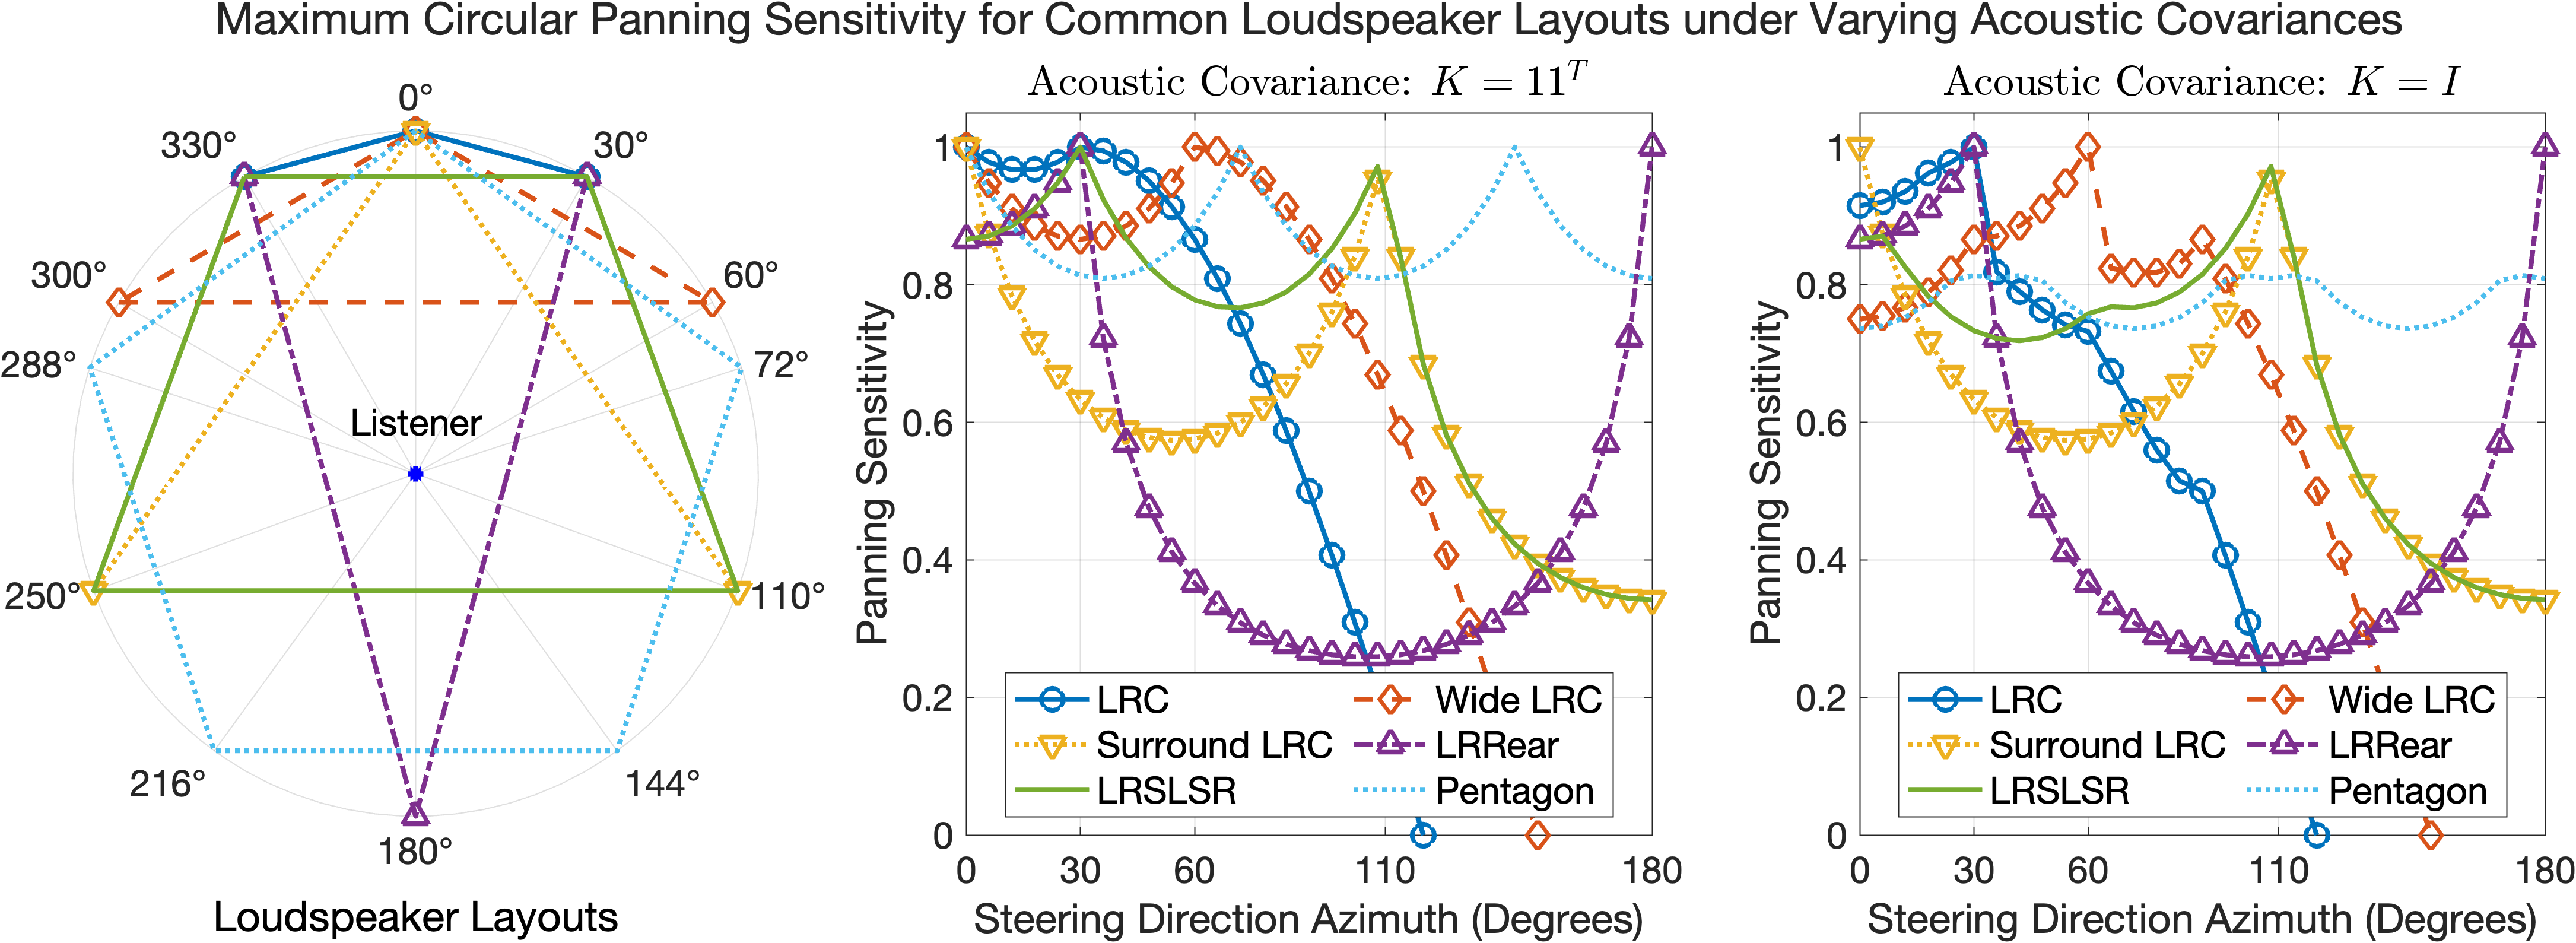
The image presents a comparative analysis of loudspeaker layouts and their corresponding panning sensitivity under varying acoustic covariance conditions. It consists of three subplots: a loudspeaker layout diagram on the left, and two line plots on the right showing panning sensitivity versus steering direction azimuth for different loudspeaker configurations under two different acoustic covariance conditions (K = 11^T and K = I).
### Components/Axes
**Left Subplot: Loudspeaker Layouts**
* **Title:** Loudspeaker Layouts
* **Description:** A circular diagram representing the spatial arrangement of loudspeakers.
* **Elements:**
* A central blue dot labeled "Listener".
* Angular markings around the circle: 0°, 30°, 60°, 72°, 110°, 144°, 180°, 216°, 250°, 288°, 300°, 330°.
* Lines connecting the angular markings, representing different loudspeaker layouts. The color and style of each line corresponds to a specific loudspeaker configuration, as detailed in the legend of the right subplots.
**Right Subplots: Panning Sensitivity vs. Steering Direction Azimuth**
* **Title (Top):** Maximum Circular Panning Sensitivity for Common Loudspeaker Layouts under Varying Acoustic Covariances
* **Titles (Middle):** Acoustic Covariance: K = 11^T (left plot), Acoustic Covariance: K = I (right plot)
* **Y-axis:** Panning Sensitivity (scale from 0 to 1, with increments of 0.2)
* **X-axis:** Steering Direction Azimuth (Degrees) (scale from 0 to 180, with markings at 0, 30, 60, 110, 180)
* **Legend (Bottom):**
* Blue line with circles: LRC
* Orange dashed line with diamonds: Wide LRC
* Yellow dotted line with downward triangles: Surround LRC
* Purple dashed line with upward triangles: LRRear
* Green solid line: LRSLSR
* Light blue dotted line: Pentagon
### Detailed Analysis
**Loudspeaker Layouts Diagram:**
* **LRC (Blue, solid):** Connects 0°, 30°, and 330°.
* **Wide LRC (Orange, dashed):** Connects 300°, 60°.
* **Surround LRC (Yellow, dotted):** Connects 250°, 72°.
* **LRRear (Purple, dashed):** Connects 180°, 330°, 30°, 180°.
* **LRSLSR (Green, solid):** Connects 110°, 250°.
* **Pentagon (Light Blue, dotted):** Connects 0°, 72°, 144°, 216°, 288°.
**Panning Sensitivity Plots (K = 11^T):**
* **LRC (Blue, circles):** Starts at approximately 0.98 at 0 degrees, decreases to approximately 0.1 at 110 degrees, then rises slightly to approximately 0.12 at 180 degrees.
* **Wide LRC (Orange, diamonds):** Starts at approximately 0.98 at 0 degrees, decreases to approximately 0.85 at 30 degrees, then rises to approximately 0.92 at 60 degrees, then decreases to approximately 0.85 at 110 degrees, then rises to approximately 0.92 at 180 degrees.
* **Surround LRC (Yellow, downward triangles):** Starts at approximately 0.98 at 0 degrees, decreases to approximately 0.35 at 180 degrees.
* **LRRear (Purple, upward triangles):** Starts at approximately 0.2 at 0 degrees, rises to approximately 0.4 at 30 degrees, then rises to approximately 0.98 at 180 degrees.
* **LRSLSR (Green, solid):** Starts at approximately 0.98 at 0 degrees, decreases to approximately 0.2 at 110 degrees, then rises to approximately 0.4 at 180 degrees.
* **Pentagon (Light Blue, dotted):** Starts at approximately 0.98 at 0 degrees, decreases to approximately 0.8 at 30 degrees, then rises to approximately 0.98 at 60 degrees, then decreases to approximately 0.8 at 110 degrees, then rises to approximately 0.98 at 180 degrees.
**Panning Sensitivity Plots (K = I):**
* **LRC (Blue, circles):** Starts at approximately 0.98 at 0 degrees, decreases to approximately 0.1 at 110 degrees, then rises slightly to approximately 0.12 at 180 degrees.
* **Wide LRC (Orange, diamonds):** Starts at approximately 0.75 at 0 degrees, rises to approximately 0.9 at 30 degrees, then decreases to approximately 0.8 at 60 degrees, then rises to approximately 0.9 at 110 degrees, then decreases to approximately 0.75 at 180 degrees.
* **Surround LRC (Yellow, downward triangles):** Starts at approximately 0.98 at 0 degrees, decreases to approximately 0.35 at 180 degrees.
* **LRRear (Purple, upward triangles):** Starts at approximately 0.2 at 0 degrees, rises to approximately 0.4 at 30 degrees, then rises to approximately 0.98 at 180 degrees.
* **LRSLSR (Green, solid):** Starts at approximately 0.98 at 0 degrees, decreases to approximately 0.2 at 110 degrees, then rises to approximately 0.4 at 180 degrees.
* **Pentagon (Light Blue, dotted):** Starts at approximately 0.98 at 0 degrees, decreases to approximately 0.75 at 30 degrees, then rises to approximately 0.85 at 60 degrees, then decreases to approximately 0.75 at 110 degrees, then rises to approximately 0.98 at 180 degrees.
### Key Observations
* The loudspeaker layout diagram visually represents the spatial arrangement of each configuration.
* The panning sensitivity plots show how the sensitivity changes as the steering direction azimuth varies.
* The acoustic covariance significantly affects the panning sensitivity for some loudspeaker layouts.
* The LRC configuration exhibits a significant drop in panning sensitivity around 110 degrees for both acoustic covariance conditions.
* The LRRear configuration shows a consistent increase in panning sensitivity as the steering direction azimuth increases.
* The Surround LRC configuration shows a consistent decrease in panning sensitivity as the steering direction azimuth increases.
### Interpretation
The data suggests that the choice of loudspeaker layout and the acoustic environment (represented by the acoustic covariance) significantly impact the panning sensitivity. Some layouts, like LRC, exhibit a significant drop in sensitivity at certain steering angles, which could lead to inconsistencies in sound localization. Other layouts, like LRRear, show a more consistent increase in sensitivity, potentially providing a more stable sound image. The acoustic covariance also plays a crucial role, as evidenced by the differences in panning sensitivity between the K = 11^T and K = I conditions, particularly for the Wide LRC configuration. This information is valuable for audio engineers and system designers in selecting the optimal loudspeaker layout for a given acoustic environment to achieve the desired panning performance.
DECODING INTELLIGENCE...