\n
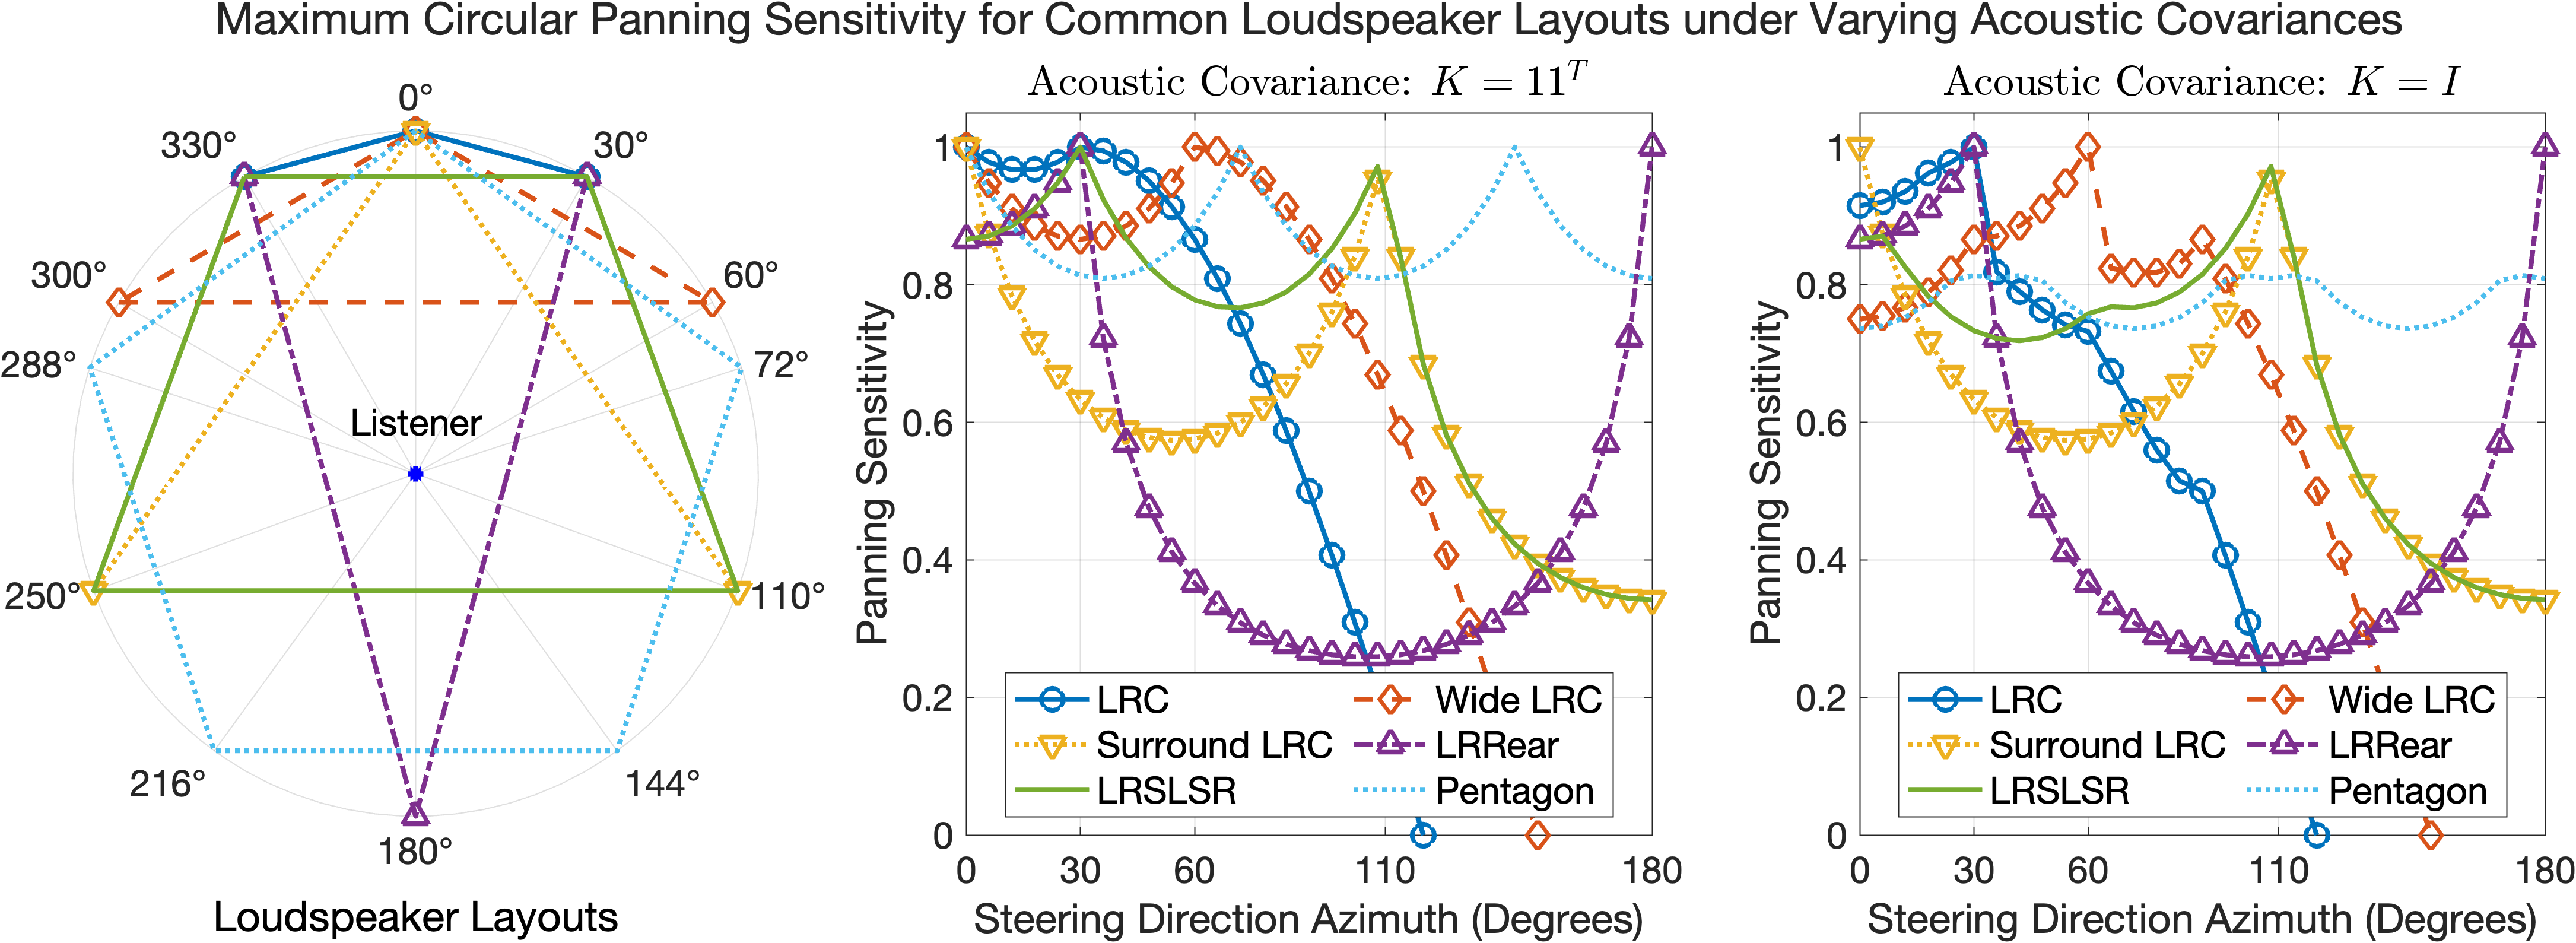
## Chart: Maximum Circular Panning Sensitivity for Common Loudspeaker Layouts
### Overview
The image presents a comparison of panning sensitivity for various loudspeaker layouts under different acoustic covariance conditions. It consists of a polar plot showing loudspeaker layouts and two line graphs illustrating panning sensitivity as a function of steering direction azimuth for two different acoustic covariance matrices.
### Components/Axes
* **Polar Plot (Left):**
* Title: "Loudspeaker Layouts"
* Angular scale: 0° to 360°
* Radial scale: 216° to 330° (approximate)
* Labels: "Listener" at the center, and lines representing different loudspeaker layouts (LRC, Wide LRC, Surround LRC, LRRear, LRLSLR, Pentagon).
* **Line Graphs (Right):**
* Title 1: "Acoustic Covariance: K = 11<sup>T</sup>"
* Title 2: "Acoustic Covariance: K = I"
* X-axis: "Steering Direction Azimuth (Degrees)" - Scale: 0° to 180°
* Y-axis: "Panning Sensitivity" - Scale: 0.0 to 1.0
* Legend:
* LRC (Blue Circle)
* Wide LRC (Red Triangle)
* Surround LRC (Yellow Diamond)
* LRRear (Purple Square)
* LRLSLR (Light Blue X)
* Pentagon (Dotted Black Line)
### Detailed Analysis
**Polar Plot:**
The polar plot displays the spatial arrangement of different loudspeaker configurations relative to a central "Listener" position. The lines represent the positions of the speakers for each layout. The angular positions of the speakers are approximately as follows:
* LRC: ~0°, ~110°, ~180°
* Wide LRC: ~0°, ~72°, ~180°
* Surround LRC: ~0°, ~110°, ~180°, ~250°
* LRRear: ~0°, ~180°, ~288°
* LRLSLR: ~0°, ~110°, ~180°, ~216°, ~330°
* Pentagon: ~0°, ~72°, ~144°, ~216°, ~288°
**Line Graphs:**
**Graph 1: Acoustic Covariance: K = 11<sup>T</sup>**
* **LRC (Blue Circle):** Starts at ~0.85 at 0°, decreases to ~0.2 at 60°, increases to ~0.6 at 110°, and decreases to ~0.3 at 180°.
* **Wide LRC (Red Triangle):** Starts at ~0.8 at 0°, decreases to ~0.3 at 60°, increases to ~0.7 at 110°, and decreases to ~0.4 at 180°.
* **Surround LRC (Yellow Diamond):** Starts at ~0.7 at 0°, decreases to ~0.4 at 60°, increases to ~0.8 at 110°, and decreases to ~0.5 at 180°.
* **LRRear (Purple Square):** Starts at ~0.6 at 0°, decreases to ~0.2 at 60°, increases to ~0.7 at 110°, and decreases to ~0.4 at 180°.
* **LRLSLR (Light Blue X):** Starts at ~0.5 at 0°, decreases to ~0.2 at 60°, increases to ~0.6 at 110°, and decreases to ~0.3 at 180°.
* **Pentagon (Dotted Black Line):** Starts at ~0.6 at 0°, decreases to ~0.3 at 60°, increases to ~0.7 at 110°, and decreases to ~0.4 at 180°.
**Graph 2: Acoustic Covariance: K = I**
* **LRC (Blue Circle):** Starts at ~0.9 at 0°, decreases to ~0.4 at 60°, increases to ~0.7 at 110°, and decreases to ~0.5 at 180°.
* **Wide LRC (Red Triangle):** Starts at ~0.9 at 0°, decreases to ~0.4 at 60°, increases to ~0.8 at 110°, and decreases to ~0.6 at 180°.
* **Surround LRC (Yellow Diamond):** Starts at ~0.8 at 0°, decreases to ~0.5 at 60°, increases to ~0.9 at 110°, and decreases to ~0.7 at 180°.
* **LRRear (Purple Square):** Starts at ~0.7 at 0°, decreases to ~0.3 at 60°, increases to ~0.8 at 110°, and decreases to ~0.6 at 180°.
* **LRLSLR (Light Blue X):** Starts at ~0.6 at 0°, decreases to ~0.2 at 60°, increases to ~0.7 at 110°, and decreases to ~0.4 at 180°.
* **Pentagon (Dotted Black Line):** Starts at ~0.7 at 0°, decreases to ~0.3 at 60°, increases to ~0.8 at 110°, and decreases to ~0.5 at 180°.
### Key Observations
* All layouts exhibit a general trend of decreasing panning sensitivity between 0° and 60°, increasing between 60° and 110°, and decreasing again between 110° and 180°.
* The "Surround LRC" layout consistently shows the highest panning sensitivity across both acoustic covariance conditions, particularly around 110°.
* The "LRLSLR" layout generally exhibits the lowest panning sensitivity.
* The acoustic covariance matrix significantly impacts the overall panning sensitivity levels, with K = I resulting in higher sensitivity values compared to K = 11<sup>T</sup>.
### Interpretation
The data suggests that the effectiveness of different loudspeaker layouts in creating a perceived sound source location is highly dependent on both the spatial arrangement of the speakers and the acoustic environment. The "Surround LRC" layout appears to be the most robust, providing the highest panning sensitivity across a wide range of steering angles and acoustic conditions. This likely stems from its ability to provide more comprehensive spatial coverage.
The difference in results between the two acoustic covariance matrices (K = 11<sup>T</sup> and K = I) indicates that the acoustic properties of the room play a crucial role in how sound is perceived. A covariance matrix of K = I suggests a more diffuse acoustic environment, where sound reflections are less directional, leading to higher overall panning sensitivity. Conversely, K = 11<sup>T</sup> suggests a more directional acoustic environment, where reflections are more focused, potentially reducing panning sensitivity.
The observed trends highlight the importance of considering both loudspeaker layout and room acoustics when designing audio systems for immersive experiences. The data could be used to optimize loudspeaker placement and equalization settings to achieve the desired spatial audio performance.