## Bar Charts: Performance by Field
### Overview
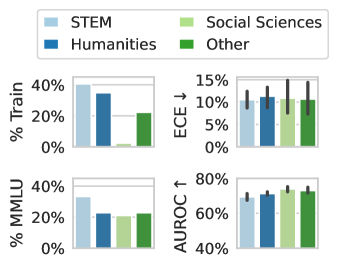
The image presents four bar charts comparing the performance of different fields (STEM, Humanities, Social Sciences, and Other) across four metrics: % Train, ECE (Error Calibration Error), % MMLU, and AUROC (Area Under the Receiver Operating Characteristic curve). The charts display the average performance for each field, with error bars indicating the variability or uncertainty in the measurements.
### Components/Axes
**Legend (Top-Left):**
* STEM: Light Blue
* Humanities: Dark Blue
* Social Sciences: Light Green
* Other: Dark Green
**Chart 1: % Train (Top-Left)**
* Y-axis Label: % Train
* Y-axis Scale: 0% to 40%
* X-axis: Implied categories (STEM, Humanities, Social Sciences, Other)
**Chart 2: ECE ↓ (Top-Right)**
* Y-axis Label: ECE ↓
* Y-axis Scale: 0% to 15%
* X-axis: Implied categories (STEM, Humanities, Social Sciences, Other)
**Chart 3: % MMLU (Bottom-Left)**
* Y-axis Label: % MMLU
* Y-axis Scale: 0% to 40%
* X-axis: Implied categories (STEM, Humanities, Social Sciences, Other)
**Chart 4: AUROC ↑ (Bottom-Right)**
* Y-axis Label: AUROC ↑
* Y-axis Scale: 40% to 80%
* X-axis: Implied categories (STEM, Humanities, Social Sciences, Other)
### Detailed Analysis
**Chart 1: % Train**
* STEM (Light Blue): Approximately 39%
* Humanities (Dark Blue): Approximately 34%
* Social Sciences (Light Green): Approximately 2%
* Other (Dark Green): Approximately 22%
**Chart 2: ECE ↓**
* STEM (Light Blue): Approximately 10% with error bars ranging from 9% to 11%
* Humanities (Dark Blue): Approximately 11% with error bars ranging from 9% to 13%
* Social Sciences (Light Green): Approximately 10% with error bars ranging from 8% to 12%
* Other (Dark Green): Approximately 10% with error bars ranging from 8% to 14%
**Chart 3: % MMLU**
* STEM (Light Blue): Approximately 32%
* Humanities (Dark Blue): Approximately 22%
* Social Sciences (Light Green): Approximately 21%
* Other (Dark Green): Approximately 22%
**Chart 4: AUROC ↑**
* STEM (Light Blue): Approximately 69% with error bars ranging from 67% to 71%
* Humanities (Dark Blue): Approximately 72% with error bars ranging from 70% to 74%
* Social Sciences (Light Green): Approximately 74% with error bars ranging from 72% to 76%
* Other (Dark Green): Approximately 73% with error bars ranging from 71% to 75%
### Key Observations
* **% Train:** STEM and Humanities have significantly higher training percentages compared to Social Sciences.
* **ECE ↓:** The ECE values are relatively similar across all fields, with overlapping error bars, suggesting no significant difference.
* **% MMLU:** STEM shows a higher MMLU percentage compared to the other fields.
* **AUROC ↑:** Social Sciences and Other fields have slightly higher AUROC scores compared to STEM and Humanities.
### Interpretation
The data suggests that the model training distribution (% Train) is heavily skewed towards STEM and Humanities. However, the error calibration (ECE) is relatively consistent across all fields. STEM demonstrates a higher performance in MMLU, while Social Sciences and Other fields show slightly better performance in AUROC. The differences in AUROC are small and may not be statistically significant given the error bars. The arrows next to ECE and AUROC indicate the desired direction of the metric (lower ECE is better, higher AUROC is better). The data indicates that the model performs differently depending on the field, which could be due to variations in the complexity or characteristics of the data within each field.