## Bar Chart: Performance Metrics Across Academic Disciplines
### Overview
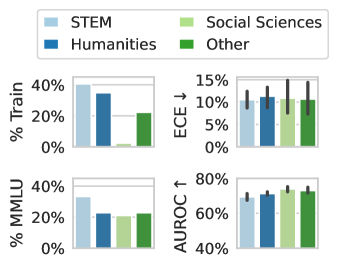
The image presents a 2x2 grid of bar charts comparing performance metrics across four academic disciplines: STEM (light blue), Humanities (dark blue), Social Sciences (light green), and Other (dark green). Each panel represents a distinct metric (% Train, ECE ↓, % MMLU, AUROC ↑) with approximate values extracted from visual estimation.
### Components/Axes
- **Legend**: Located in the top-left corner, mapping colors to disciplines:
- Light blue: STEM
- Dark blue: Humanities
- Light green: Social Sciences
- Dark green: Other
- **Y-Axes**:
- Top-left (% Train): 0% to 40%
- Top-right (ECE ↓): 0% to 15%
- Bottom-left (% MMLU): 0% to 40%
- Bottom-right (AUROC ↑): 40% to 80%
- **X-Axes**: Shared across all panels, listing disciplines (STEM, Humanities, Social Sciences, Other).
### Detailed Analysis
#### Top-Left Panel (% Train)
- **Trend**: STEM (40%) > Humanities (35%) > Other (20%) > Social Sciences (5%).
- **Values**:
- STEM: ~40% (light blue)
- Humanities: ~35% (dark blue)
- Social Sciences: ~5% (light green)
- Other: ~20% (dark green)
#### Top-Right Panel (ECE ↓)
- **Trend**: Humanities (~12%) > STEM (~10%) > Social Sciences (~8%) > Other (~10%).
- **Values**:
- STEM: ~10% (light blue)
- Humanities: ~12% (dark blue)
- Social Sciences: ~8% (light green)
- Other: ~10% (dark green)
#### Bottom-Left Panel (% MMLU)
- **Trend**: STEM (~30%) > Humanities (~25%) > Other (~22%) > Social Sciences (~20%).
- **Values**:
- STEM: ~30% (light blue)
- Humanities: ~25% (dark blue)
- Social Sciences: ~20% (light green)
- Other: ~22% (dark green)
#### Bottom-Right Panel (AUROC ↑)
- **Trend**: Other (~78%) > Humanities (~75%) > STEM (~70%) > Social Sciences (~72%).
- **Values**:
- STEM: ~70% (light blue)
- Humanities: ~75% (dark blue)
- Social Sciences: ~72% (light green)
- Other: ~78% (dark green)
### Key Observations
1. **STEM Dominance**: Consistently highest in % Train (40%) and % MMLU (30%).
2. **Humanities Edge**: Outperforms STEM in ECE (12% vs. 10%) and AUROC (75% vs. 70%).
3. **Social Sciences**: Lowest in % Train (5%) but mid-range in AUROC (72%).
4. **Other**: Strongest in AUROC (78%) and mid-range in % MMLU (22%).
### Interpretation
The data suggests disciplinary specialization in performance metrics:
- **STEM** excels in foundational training (% Train) and knowledge assessment (% MMLU), likely due to structured curricula.
- **Humanities** shows resilience in error correction (ECE) and generalization (AUROC), possibly reflecting nuanced analytical skills.
- **Other** (potentially interdisciplinary fields) achieves highest AUROC, indicating robust model performance across diverse tasks.
- **Social Sciences** underperforms in training but maintains mid-tier generalization, suggesting potential gaps in foundational knowledge transfer.
The metrics highlight trade-offs between discipline-specific expertise and cross-domain adaptability, with implications for curriculum design and AI model development.