## Flowchart: Audio Processing Pipeline with Iterative Feedback Loop
### Overview
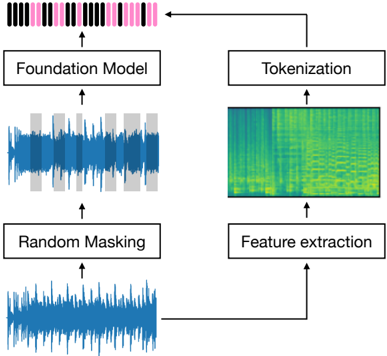
The diagram illustrates a cyclical machine learning pipeline for audio processing, featuring four core components connected by directional arrows. The process begins with "Random Masking" of audio data, progresses through "Foundation Model" and "Tokenization" stages, and loops back via "Feature extraction" to refine the initial masking step. Visualizations include waveforms, spectrograms, and heatmaps to represent data transformations.
### Components/Axes
1. **Nodes**:
- **Random Masking**: Input/output waveform (blue) with gray masking blocks.
- **Foundation Model**: Spectrogram visualization (blue/gray).
- **Tokenization**: Heatmap (green/yellow gradient).
- **Feature extraction**: Heatmap (green/yellow/pink gradient).
2. **Arrows**: Indicate unidirectional flow between components, forming a closed loop.
3. **Visual Elements**:
- Waveforms: Time-domain audio representations.
- Spectrograms: Frequency-time domain visualizations.
- Heatmaps: Token/feature distribution intensities.
### Detailed Analysis
1. **Random Masking**:
- Input: Unprocessed audio waveform (blue).
- Output: Masked waveform with periodic gray blocks (approximate 20% masking ratio).
- Spatial: Bottom-left node, connected to Foundation Model.
2. **Foundation Model**:
- Input: Masked waveform.
- Output: Spectrogram (blue/gray), showing frequency distribution over time.
- Spatial: Center-left node, connected to Tokenization.
3. **Tokenization**:
- Input: Spectrogram.
- Output: Heatmap with green/yellow gradient (higher intensity = warmer colors).
- Spatial: Top-center node, connected to Feature extraction.
4. **Feature extraction**:
- Input: Tokenized heatmap.
- Output: Enhanced heatmap with pink highlights (indicating critical features).
- Spatial: Bottom-right node, feeding back to Random Masking.
### Key Observations
- **Iterative Design**: The loop suggests a reinforcement learning framework where feature extraction informs masking adjustments.
- **Color Coding**:
- Blue/gray in spectrogram likely represents frequency magnitude.
- Green/yellow/pink in heatmaps may indicate token importance or feature saliency (no explicit legend).
- **Masking Ratio**: Estimated 15-25% of waveform segments are masked (visual approximation).
### Interpretation
This pipeline demonstrates a closed-loop system for self-supervised audio learning:
1. **Masking as Augmentation**: Randomly obscuring audio segments forces the model to learn robust representations.
2. **Spectrogram Conversion**: Transforms time-domain data into frequency features for downstream tasks.
3. **Tokenization**: Breaks spectrogram data into discrete units (e.g., phonemes or mel-frequency cepstral coefficients).
4. **Feature Refinement**: The feedback loop implies that extracted features are used to optimize masking patterns, potentially improving model generalization.
The absence of explicit numerical values suggests this is a conceptual diagram rather than an empirical study. The heatmap color gradients likely represent relative intensities rather than absolute measurements. This architecture aligns with modern self-supervised learning approaches like Wav2Vec 2.0, where masked audio modeling is combined with feature extraction for downstream tasks.