# Technical Document Extraction: Attention over Values, a=80
## Chart Description
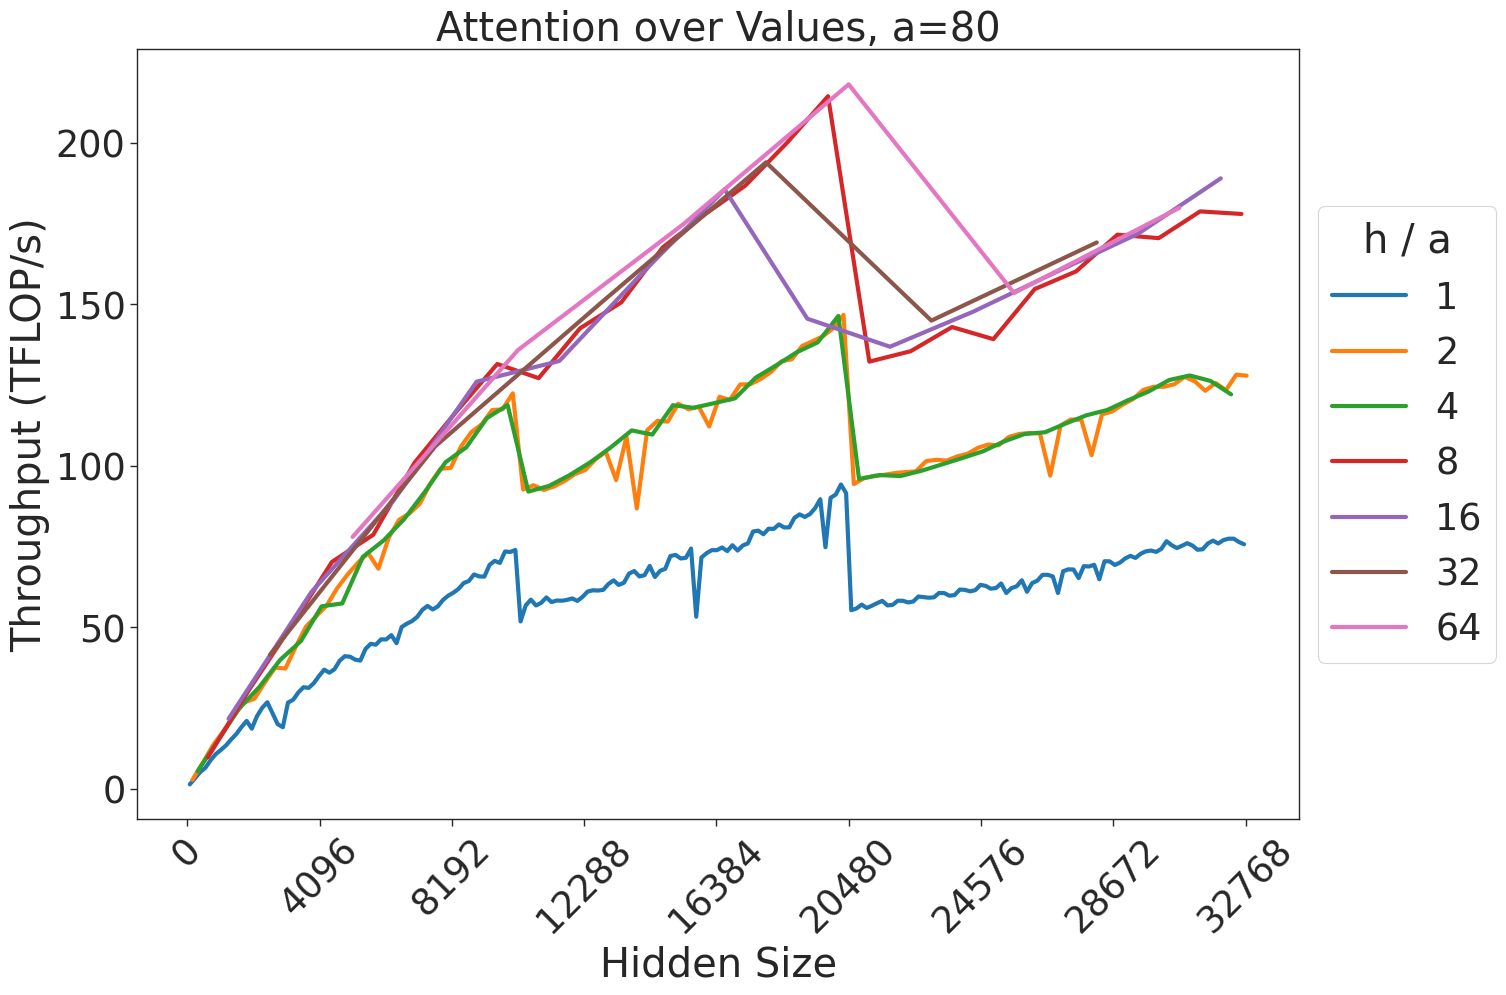
This image is a **line chart** titled **"Attention over Values, a=80"**. It visualizes the relationship between **Hidden Size** (x-axis) and **Throughput (TFLOP/s)** (y-axis) for different **h/a** ratios. The chart includes seven data series, each represented by a distinct color and labeled in the legend.
---
### Axis Labels and Ranges
- **X-axis (Hidden Size)**:
- Range: `0` to `32768`
- Tick marks at: `0`, `4096`, `8192`, `12288`, `16384`, `20480`, `24576`, `28672`, `32768`
- **Y-axis (Throughput (TFLOP/s))**:
- Range: `0` to `200`
- Tick marks at: `0`, `50`, `100`, `150`, `200`
---
### Legend
The legend is positioned on the **right side** of the chart. It maps **h/a ratios** to colors:
| Color | h/a Ratio |
|-------------|-----------|
| Blue | 1 |
| Orange | 2 |
| Green | 4 |
| Red | 8 |
| Purple | 16 |
| Brown | 32 |
| Pink | 64 |
---
### Data Series Analysis
#### 1. **h/a = 1 (Blue Line)**
- **Trend**: Gradual upward slope with minor fluctuations.
- **Key Points**:
- At `Hidden Size = 0`: Throughput ≈ `0` TFLOP/s.
- At `Hidden Size = 32768`: Throughput ≈ `75` TFLOP/s.
#### 2. **h/a = 2 (Orange Line)**
- **Trend**: Similar to h/a=1 but with sharper increases and dips.
- **Key Points**:
- At `Hidden Size = 0`: Throughput ≈ `0` TFLOP/s.
- At `Hidden Size = 32768`: Throughput ≈ `125` TFLOP/s.
#### 3. **h/a = 4 (Green Line)**
- **Trend**: Steeper growth with a peak at `Hidden Size = 16384`, followed by a decline.
- **Key Points**:
- At `Hidden Size = 0`: Throughput ≈ `0` TFLOP/s.
- Peak at `Hidden Size = 16384`: Throughput ≈ `150` TFLOP/s.
- At `Hidden Size = 32768`: Throughput ≈ `120` TFLOP/s.
#### 4. **h/a = 8 (Red Line)**
- **Trend**: Sharp peak at `Hidden Size = 20480`, then a decline.
- **Key Points**:
- At `Hidden Size = 0`: Throughput ≈ `0` TFLOP/s.
- Peak at `Hidden Size = 20480`: Throughput ≈ `210` TFLOP/s.
- At `Hidden Size = 32768`: Throughput ≈ `180` TFLOP/s.
#### 5. **h/a = 16 (Purple Line)**
- **Trend**: Rapid growth with a peak at `Hidden Size = 16384`, followed by a decline.
- **Key Points**:
- At `Hidden Size = 0`: Throughput ≈ `0` TFLOP/s.
- Peak at `Hidden Size = 16384`: Throughput ≈ `190` TFLOP/s.
- At `Hidden Size = 32768`: Throughput ≈ `170` TFLOP/s.
#### 6. **h/a = 32 (Brown Line)**
- **Trend**: Steep rise with a peak at `Hidden Size = 20480`, then a decline.
- **Key Points**:
- At `Hidden Size = 0`: Throughput ≈ `0` TFLOP/s.
- Peak at `Hidden Size = 20480`: Throughput ≈ `195` TFLOP/s.
- At `Hidden Size = 32768`: Throughput ≈ `160` TFLOP/s.
#### 7. **h/a = 64 (Pink Line)**
- **Trend**: Highest peak at `Hidden Size = 20480`, followed by a decline.
- **Key Points**:
- At `Hidden Size = 0`: Throughput ≈ `0` TFLOP/s.
- Peak at `Hidden Size = 20480`: Throughput ≈ `220` TFLOP/s.
- At `Hidden Size = 32768`: Throughput ≈ `185` TFLOP/s.
---
### Observations
- **Peak Throughput**: The highest throughput (≈220 TFLOP/s) occurs at `h/a = 64` and `Hidden Size = 20480`.
- **Scaling Behavior**: Larger `h/a` ratios (e.g., 16, 32, 64) show higher throughput but with more pronounced peaks and declines.
- **Stability**: Smaller `h/a` ratios (e.g., 1, 2, 4) exhibit smoother, more gradual increases.
---
### Notes
- No additional text, tables, or diagrams are present in the image.
- All data points and trends are derived from the visual representation of the chart.
- The chart does not include any annotations or embedded text beyond the legend and axis labels.