# Technical Analysis of Llama 33B Performance on A100 80GB PCIe
## Graph Title
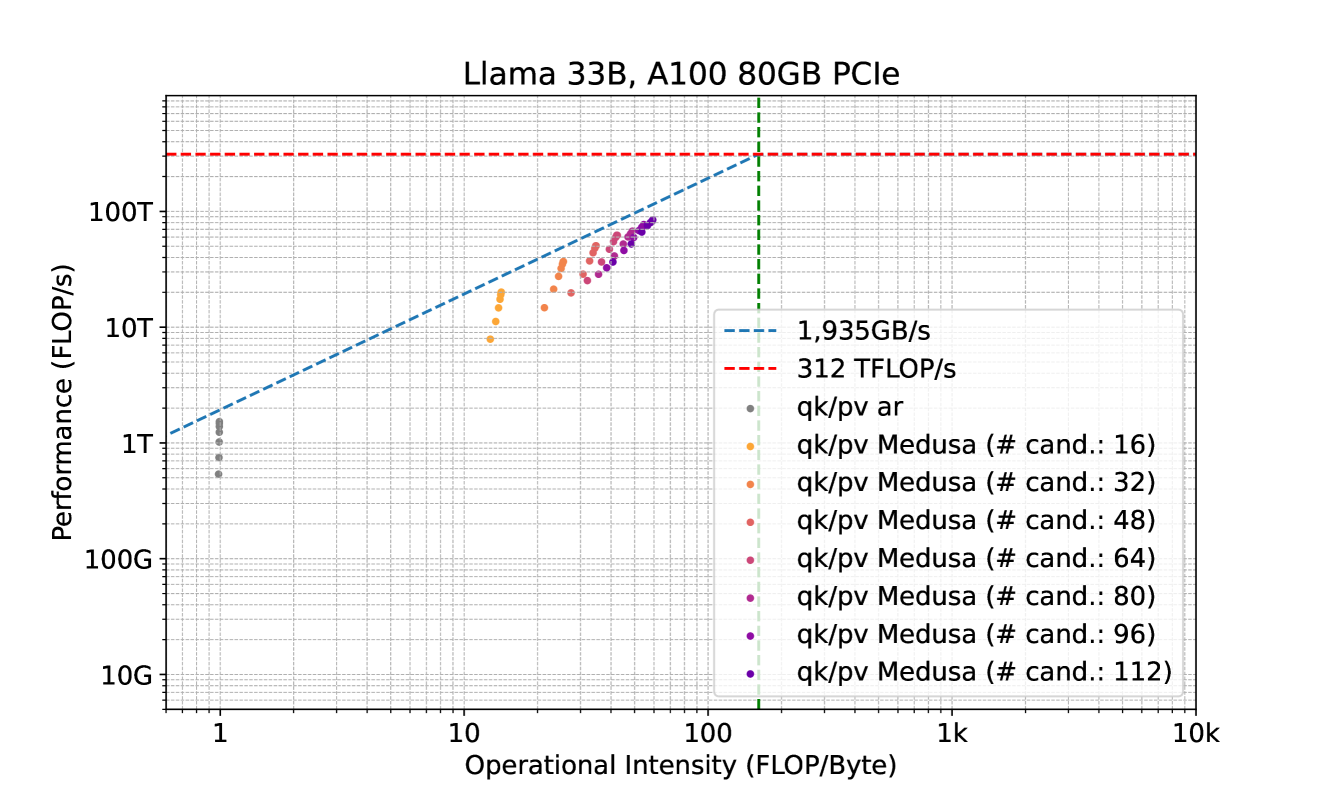
**Llama 33B, A100 80GB PCIe**
## Axes
- **X-axis**: Operational Intensity (FLOP/Byte)
- Markers: 1, 10, 100, 1k, 10k
- **Y-axis**: Performance (FLOP/s)
- Markers: 10G, 100G, 1T, 10T, 100T
## Legend
1. **Dashed Blue Line**: 1,935GB/s
2. **Dashed Red Line**: 312 TFLOP/s
3. **Data Points**:
- **Gray Dot**: qk/pv ar
- **Colored Dots**:
- Orange: qk/pv Medusa (# cand.: 16)
- Light Orange: qk/pv Medusa (# cand.: 32)
- Red-Orange: qk/pv Medusa (# cand.: 48)
- Pink: qk/pv Medusa (# cand.: 64)
- Purple: qk/pv Medusa (# cand.: 80)
- Dark Purple: qk/pv Medusa (# cand.: 96)
- Violet: qk/pv Medusa (# cand.: 112)
## Key Trends
1. **Performance Scaling**:
- Performance increases linearly with operational intensity up to **100 FLOP/Byte**, following the dashed blue line (1,935GB/s).
- Beyond 100 FLOP/Byte, performance plateaus at **312 TFLOP/s** (dashed red line).
2. **Configuration Performance**:
- **qk/pv ar** (gray dot) achieves ~1T FLOP/s at ~1 FLOP/Byte.
- **qk/pv Medusa** configurations show incremental performance gains with higher candidate counts:
- 16 candidates: ~10T FLOP/s at ~10 FLOP/Byte.
- 112 candidates: ~100T FLOP/s at ~100 FLOP/Byte.
3. **Critical Thresholds**:
- **Green Vertical Line**: Marks 100 FLOP/Byte (operational intensity limit).
- **Red Horizontal Line**: Represents maximum achievable performance (312 TFLOP/s).
## Observations
- All configurations converge to the 312 TFLOP/s ceiling at operational intensities ≥100 FLOP/Byte.
- Higher candidate counts in qk/pv Medusa improve performance but require proportional increases in operational intensity.
- The "qk/pv ar" baseline underperforms compared to Medusa configurations across all intensities.