\n
## Data Table: Operation Latency
### Overview
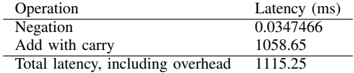
The image presents a data table detailing the latency (in milliseconds) of different operations. The table lists "Negation" and "Add with carry" as individual operations, and provides a "Total latency, including overhead" value.
### Components/Axes
The table has two columns:
* **Operation:** Lists the type of operation performed.
* **Latency (ms):** Indicates the time taken for the operation to complete, measured in milliseconds.
### Detailed Analysis or Content Details
The table contains the following data:
* **Negation:** Latency = 0.0347466 ms
* **Add with carry:** Latency = 1058.65 ms
* **Total latency, including overhead:** Latency = 1115.25 ms
### Key Observations
The latency for "Add with carry" is significantly higher than that of "Negation". The total latency is only slightly higher than the "Add with carry" latency, suggesting that the overhead is relatively small compared to the "Add with carry" operation itself.
### Interpretation
This data suggests that the "Add with carry" operation is the dominant factor in the overall latency. The extremely low latency of "Negation" indicates it is a very fast operation. The difference in latency between the two operations could be due to the complexity of the "Add with carry" operation, potentially involving multiple steps or more extensive hardware resources. The total latency provides a realistic measure of the time taken to perform the operations, including any system-level overhead. This information is valuable for performance analysis and optimization, highlighting the "Add with carry" operation as a potential target for improvement.