## Table: Latency Analysis of Operations
### Overview
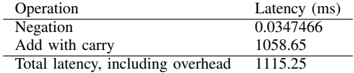
The image presents a table comparing the latency (in milliseconds) of three operations: "Negation," "Add with carry," and "Total latency, including overhead." The data highlights significant differences in execution times between operations.
### Components/Axes
- **Columns**:
- **Operation**: Lists the computational operations analyzed.
- **Latency (ms)**: Specifies the time taken for each operation in milliseconds.
- **Rows**:
1. **Negation**: Latency = 0.0347466 ms.
2. **Add with carry**: Latency = 1058.65 ms.
3. **Total latency, including overhead**: Latency = 1115.25 ms.
### Detailed Analysis
- **Negation**: The shortest latency at **0.0347466 ms**, indicating near-instantaneous execution.
- **Add with carry**: Dominates with **1058.65 ms**, approximately **30,000x longer** than Negation.
- **Total latency**: Sum of all operations and overhead, totaling **1115.25 ms**. This suggests overhead contributes **~56.6 ms** (1115.25 - 1058.65 - 0.0347466).
### Key Observations
1. **Add with carry** is the primary contributor to total latency, accounting for **~94.9%** of the total time.
2. **Overhead** (56.6 ms) is non-trivial, representing **~5.1%** of the total latency.
3. **Negation** has negligible impact on overall performance.
### Interpretation
The data underscores that **Add with carry** is the critical bottleneck in this system. While Negation is nearly instantaneous, the Add operation’s high latency drives the total execution time. The overhead (56.6 ms) suggests additional system-level delays (e.g., context switching, memory access) that are not directly tied to the operations themselves. This highlights the need for optimization in Add with carry logic or hardware acceleration to reduce total latency. The stark contrast between operations also raises questions about the system’s design, as such a disparity may indicate inefficiencies in resource allocation or algorithmic complexity.