\n
## Diagram: Chain-of-Thought (CoT) vs. Chain of Continuous Thought (CoCoNUT)
### Overview
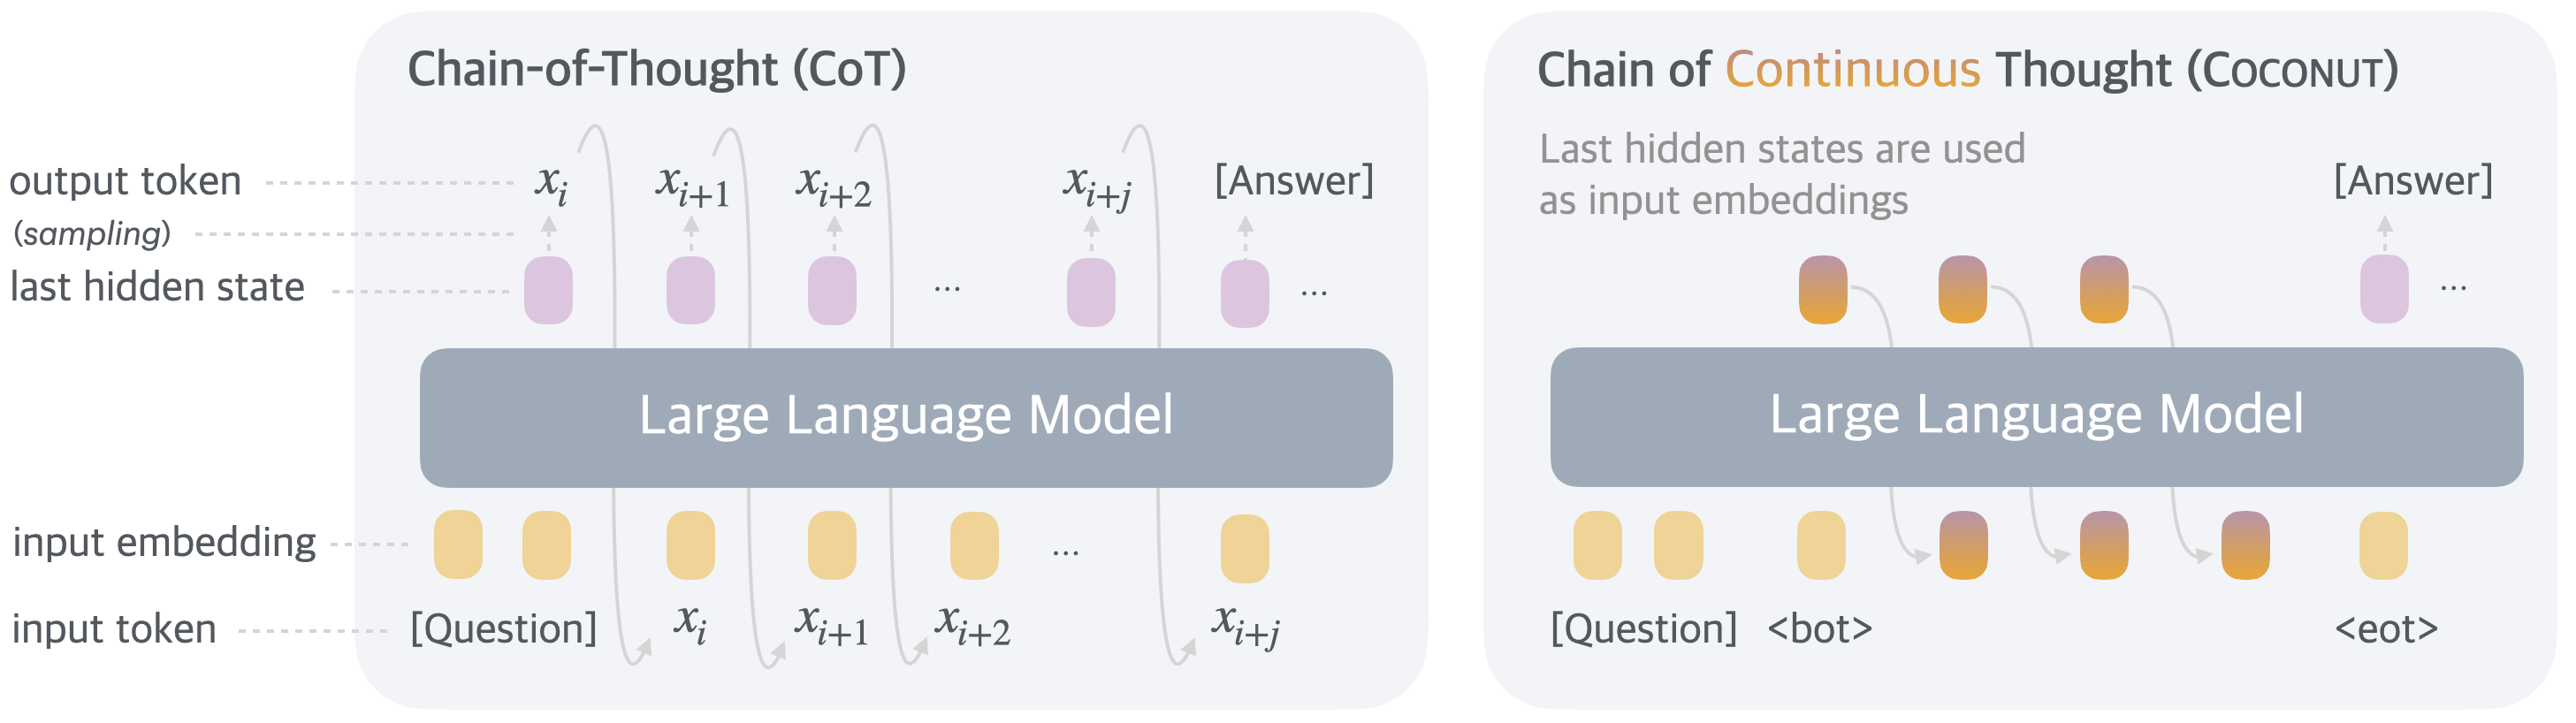
The image presents a comparative diagram illustrating the processes of Chain-of-Thought (CoT) and Chain of Continuous Thought (CoCoNUT) within a Large Language Model (LLM). Both diagrams depict the flow of input tokens, embeddings, hidden states, and output tokens. The key difference lies in how the next input is generated. CoT uses sampling of output tokens as input, while CoCoNUT uses the last hidden states as input embeddings.
### Components/Axes
The diagram consists of two main sections, one for each method (CoT and CoCoNUT). Each section includes the following components:
* **Large Language Model:** Represented by a large, light blue rectangle.
* **Input Token:** Labeled as "[Question]" and represented by yellow circles.
* **Input Embedding:** Represented by yellow circles.
* **Last Hidden State:** Represented by purple circles.
* **Output Token (sampling):** Labeled as "x<sub>i</sub>", "x<sub>i+1</sub>", "x<sub>i+2</sub>", "x<sub>i+j</sub>" and "[Answer]", represented by purple circles.
* **Arrows:** Indicate the flow of information between components.
* **Text Annotations:** Describe the process within each method.
* **CoCoNUT Specific:** `<bot>` and `<eot>` tokens are present.
### Detailed Analysis or Content Details
**Chain-of-Thought (CoT) - Left Side:**
* **Input:** Starts with "[Question]" as the input token, converted to an input embedding (yellow circle).
* **Processing:** The input embedding is fed into the Large Language Model.
* **Output & Feedback:** The LLM generates a series of output tokens (x<sub>i</sub>, x<sub>i+1</sub>, x<sub>i+2</sub>, x<sub>i+j</sub>) and ultimately "[Answer]". Each output token is also represented as a last hidden state (purple circle).
* **Loop:** The output tokens (x<sub>i</sub>) are then fed back into the LLM as the next input token, continuing the chain of thought. The ellipsis (...) indicates this process repeats.
**Chain of Continuous Thought (CoCoNUT) - Right Side:**
* **Input:** Begins with "[Question]" as the input token, converted to an input embedding (yellow circle).
* **Processing:** The input embedding is fed into the Large Language Model.
* **Output & Feedback:** The LLM generates a series of output tokens (represented by purple circles) and ultimately "[Answer]".
* **Hidden State as Input:** Instead of sampling the output tokens, the *last hidden states* (purple circles) are used as input embeddings for the next iteration. This is explicitly stated in the text annotation: "Last hidden states are used as input embeddings".
* **Special Tokens:** The diagram also shows the use of `<bot>` and `<eot>` tokens. `<bot>` is used as an input token, and `<eot>` is the final output token.
### Key Observations
* The primary distinction between CoT and CoCoNUT is the source of the next input. CoT uses sampled output tokens, while CoCoNUT leverages the last hidden states.
* Both methods utilize a Large Language Model as the core processing unit.
* The use of ellipsis (...) in both diagrams suggests an iterative process.
* CoCoNUT introduces special tokens `<bot>` and `<eot>` which are not present in CoT.
### Interpretation
The diagram illustrates two different approaches to enabling a Large Language Model to perform complex reasoning tasks. CoT relies on generating and feeding back the model's own outputs, creating a chain of thought through sampling. CoCoNUT, on the other hand, aims to maintain a continuous flow of information by using the model's internal representations (hidden states) as the basis for subsequent processing.
The choice between these methods likely impacts the model's performance in terms of coherence, consistency, and the ability to avoid getting stuck in repetitive loops. CoCoNUT's use of hidden states could potentially lead to more efficient and focused reasoning, while CoT's sampling approach might introduce more diversity and creativity. The inclusion of `<bot>` and `<eot>` tokens in CoCoNUT suggests a more structured dialogue or task completion framework.
The diagram is a high-level conceptual illustration and does not provide specific quantitative data. It serves to highlight the architectural differences between the two methods and their respective information flows.