# Technical Document Analysis of Scatter Plot
## Key Components and Labels
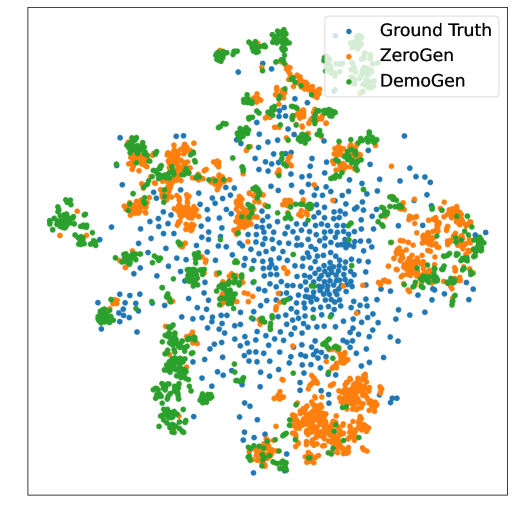
- **Legend**: Located in the top-right corner, categorizes data points into three groups:
- **Ground Truth**: Blue dots
- **ZeroGen**: Orange dots
- **DemoGen**: Green dots
- **Axes**:
- **X-axis**: Labeled "Dimension 1"
- **Y-axis**: Labeled "Dimension 2"
## Data Distribution Patterns
1. **Ground Truth (Blue)**:
- Most dispersed distribution across the plot.
- Forms a broad, irregular cluster with no distinct sub-groups.
- High density in the central region, tapering toward the edges.
2. **ZeroGen (Orange)**:
- Forms dense, well-defined clusters.
- Clusters are concentrated in specific regions (e.g., bottom-left, top-right).
- Minimal overlap with other categories.
3. **DemoGen (Green)**:
- Mixed distribution: some dense clusters and dispersed points.
- Clusters overlap with both Ground Truth and ZeroGen regions.
- Higher density in mid-range regions of Dimension 1 and 2.
## Observations
- **ZeroGen** demonstrates the most structured grouping, suggesting strong category separation.
- **DemoGen** exhibits intermediate behavior, with partial clustering and dispersion.
- **Ground Truth** serves as a reference for natural data distribution, showing less organization than ZeroGen.
## Technical Notes
- No explicit title is present in the plot.
- The visualization likely represents a dimensionality reduction (e.g., PCA, t-SNE) of high-dimensional data.
- No numerical axis markers or gridlines are visible; axes are continuous and unlabeled beyond their titles.