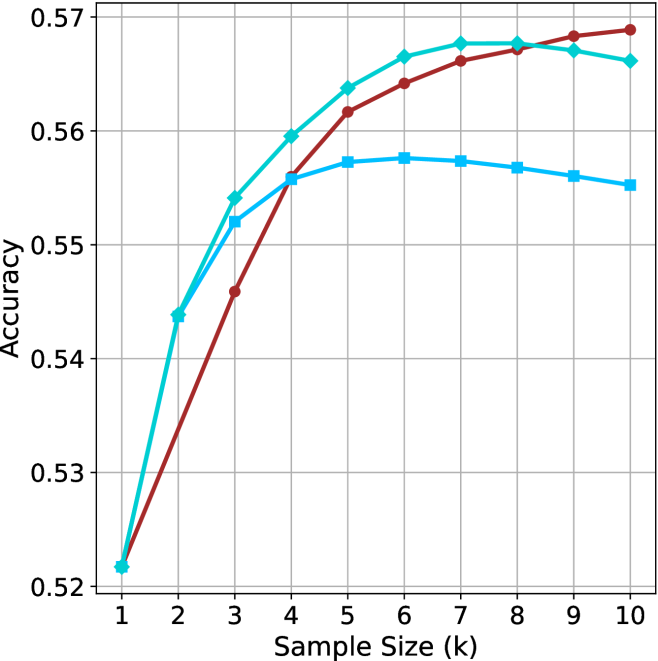
## Line Chart: Accuracy vs. Sample Size (k)
### Overview
The image is a line chart plotting model or method accuracy against sample size. It displays three distinct data series, each represented by a colored line with markers, showing how accuracy changes as the sample size increases from 1 to 10. The chart includes a grid for easier reading of values.
### Components/Axes
* **X-Axis (Horizontal):** Labeled "Sample Size (k)". It has integer markers from 1 to 10.
* **Y-Axis (Vertical):** Labeled "Accuracy". It has numerical markers from 0.52 to 0.57, with major grid lines at intervals of 0.01.
* **Data Series (Lines):** There are three lines, differentiated by color and marker shape. There is no explicit legend box within the chart area; the series must be identified by their visual properties.
1. **Cyan Line:** Uses diamond-shaped markers (◆).
2. **Teal Line:** Uses square markers (■).
3. **Maroon Line:** Uses circular markers (●).
* **Grid:** A light gray grid is present, with vertical lines at each integer sample size and horizontal lines at each 0.01 accuracy increment.
### Detailed Analysis
**Trend Verification & Data Point Extraction:**
* **Cyan Line (Diamonds):** Shows a steep initial increase, peaks, and then slightly declines.
* k=1: ~0.522
* k=2: ~0.544
* k=3: ~0.554
* k=4: ~0.560
* k=5: ~0.564
* k=6: ~0.567
* k=7: ~0.568 (Peak)
* k=8: ~0.568
* k=9: ~0.567
* k=10: ~0.566
* **Teal Line (Squares):** Increases rapidly at first, then plateaus and shows a very slight downward trend.
* k=1: ~0.522
* k=2: ~0.544
* k=3: ~0.552
* k=4: ~0.556
* k=5: ~0.557
* k=6: ~0.558 (Peak)
* k=7: ~0.5575
* k=8: ~0.557
* k=9: ~0.556
* k=10: ~0.555
* **Maroon Line (Circles):** Shows a steady, consistent increase across the entire range, ending as the highest point.
* k=1: ~0.522
* k=2: ~0.534
* k=3: ~0.546
* k=4: ~0.556
* k=5: ~0.561
* k=6: ~0.564
* k=7: ~0.566
* k=8: ~0.567
* k=9: ~0.568
* k=10: ~0.569 (Highest point on chart)
### Key Observations
1. **Convergent Start:** All three methods start at approximately the same accuracy (~0.522) when the sample size is 1.
2. **Divergent Paths:** The lines diverge significantly between k=2 and k=5. The cyan and teal lines rise faster initially than the maroon line.
3. **Peak and Plateau Behavior:** The cyan line peaks around k=7-8 and then declines. The teal line peaks earlier (k=6) and declines more gradually. The maroon line shows no sign of peaking within the given range.
4. **Final Ranking:** At the largest sample size (k=10), the maroon line has the highest accuracy, followed by the cyan line, with the teal line having the lowest accuracy of the three.
5. **Diminishing Returns:** All lines show diminishing returns; the gain in accuracy per additional sample is much larger for small k (1 to 4) than for large k (7 to 10).
### Interpretation
This chart likely compares the performance of three different algorithms, models, or sampling strategies as more data becomes available. The data suggests:
* **The Maroon method** benefits most consistently from additional data. Its steady upward trend implies it may have a higher capacity to learn from more samples or is less prone to overfitting within this range. It is the best choice if large sample sizes (k=10) are available.
* **The Cyan method** is highly effective with moderate sample sizes, achieving the highest accuracy in the mid-range (k=7-8). However, its slight decline at k=9-10 could indicate the onset of overfitting or that its optimal performance window has been passed.
* **The Teal method** learns quickly from the first few samples but hits a performance ceiling early (around k=6). Adding more data beyond this point provides no benefit and may even slightly hurt performance. This could be a simpler model or one with high bias.
The key takeaway is that "more data" is not universally better for all methods. The optimal sample size depends on the specific method used. There is a clear trade-off between the rapid initial gains of the Cyan/Teal methods and the sustained, long-term improvement of the Maroon method. An investigator would need to consider the cost of acquiring larger samples versus the required accuracy to choose the best method for their specific constraints.