## Line Graph: Model Accuracy vs. Sample Size
### Overview
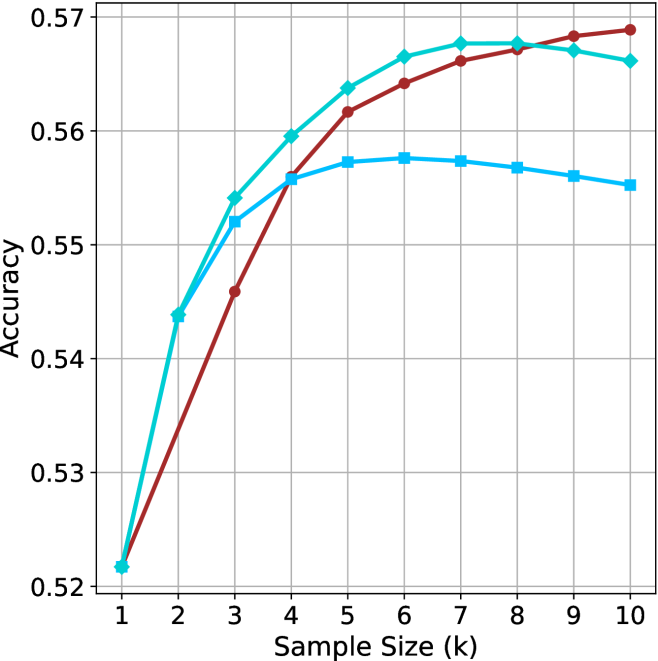
The image depicts a line graph comparing the accuracy of three models (Model A, Model B, Model C) across varying sample sizes (k = 1 to 10). The y-axis represents accuracy (0.52 to 0.57), while the x-axis represents sample size. All models start at the same baseline accuracy but diverge in their growth trajectories before plateauing.
### Components/Axes
- **X-axis**: Sample Size (k) with integer markers from 1 to 10.
- **Y-axis**: Accuracy, scaled from 0.52 to 0.57 in increments of 0.01.
- **Legend**: Located in the top-right corner, associating:
- **Red**: Model A
- **Teal**: Model B
- **Blue**: Model C
### Detailed Analysis
1. **Model A (Red Line)**:
- Starts at 0.52 (k=1).
- Sharp increase to 0.54 at k=2.
- Continues rising to 0.56 at k=3, then plateaus at ~0.57 from k=4 to k=10.
- **Key Data Points**:
- k=1: 0.52
- k=2: 0.54
- k=3: 0.56
- k=4–10: ~0.57
2. **Model B (Teal Line)**:
- Starts at 0.52 (k=1).
- Gradual increase to 0.54 at k=2, then 0.55 at k=3.
- Reaches 0.56 at k=4, plateaus at ~0.56 from k=5 to k=10.
- **Key Data Points**:
- k=1: 0.52
- k=2: 0.54
- k=3: 0.55
- k=4: 0.56
- k=5–10: ~0.56
3. **Model C (Blue Line)**:
- Starts at 0.52 (k=1).
- Gradual increase to 0.54 at k=2, then 0.55 at k=3.
- Reaches 0.56 at k=4, plateaus at ~0.56 from k=5 to k=10.
- **Key Data Points**:
- k=1: 0.52
- k=2: 0.54
- k=3: 0.55
- k=4: 0.56
- k=5–10: ~0.56
### Key Observations
- **Initial Divergence**: Model A exhibits a steeper initial increase compared to Models B and C.
- **Convergence**: By k=4, all models achieve similar accuracy (~0.56), with minimal further improvement beyond this point.
- **Plateau Effect**: All models stabilize between k=4 and k=10, suggesting diminishing returns for larger sample sizes.
### Interpretation
The graph demonstrates that increasing sample size improves model accuracy, but the rate of improvement varies. Model A outperforms others initially due to its rapid early gains, likely reflecting a more efficient learning mechanism or better initial configuration. However, by k=4, all models converge, indicating that sample size alone cannot drive significant accuracy gains beyond a certain threshold. This suggests that factors like model architecture, data quality, or hyperparameter tuning may play a more critical role in performance beyond a moderate sample size. The plateau effect highlights the importance of balancing computational resources with diminishing returns in real-world applications.