## Diagram: Data Buffer and Broadcast Activity Across Devices
### Overview
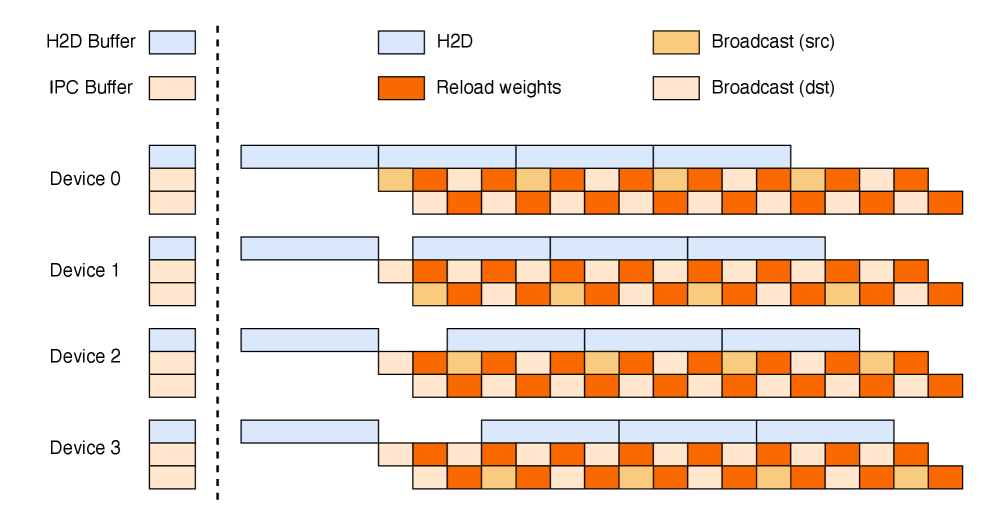
The diagram illustrates data buffer management and communication patterns across four devices (Device 0–3). It visualizes four data flow categories (H2D, Reload weights, Broadcast src, Broadcast dst) using color-coded horizontal segments stacked vertically for each device. The layout emphasizes buffer allocation (H2D Buffer and IPC Buffer) and data distribution patterns.
### Components/Axes
- **Vertical Axis (Left)**:
- Labels: "Device 0", "Device 1", "Device 2", "Device 3" (bottom to top).
- Sub-components:
- Top segment: "H2D Buffer" (blue).
- Bottom segment: "IPC Buffer" (light orange).
- **Horizontal Axis (Top)**:
- Segments labeled: "H2D", "Broadcast (src)", "Reload weights", "Broadcast (dst)".
- **Legend (Top Right)**:
- Blue: H2D.
- Orange: Reload weights.
- Light yellow: Broadcast (src).
- Light orange: Broadcast (dst).
### Detailed Analysis
1. **H2D Buffer (Blue)**:
- Device 0: Longest segment (~40% of total width).
- Device 1: ~35%.
- Device 2: ~30%.
- Device 3: ~25%.
- *Trend*: Decreasing length from Device 0 to 3.
2. **Broadcast (src) (Light Yellow)**:
- Device 0: ~25%.
- Device 1: ~20%.
- Device 2: ~18%.
- Device 3: ~15%.
- *Trend*: Gradual decline across devices.
3. **Reload weights (Orange)**:
- Device 0: ~15%.
- Device 1: ~12%.
- Device 2: ~10%.
- Device 3: ~8%.
- *Trend*: Consistent reduction from top to bottom.
4. **Broadcast (dst) (Light Orange)**:
- Device 0: ~10%.
- Device 1: ~12%.
- Device 2: ~15%.
- Device 3: ~20%.
- *Trend*: Increasing length from Device 0 to 3.
5. **IPC Buffer (Light Orange)**:
- Uniform width (~5%) across all devices, positioned below the main data segments.
### Key Observations
- **H2D Dominance**: Device 0 has the largest H2D segment, suggesting it handles the highest direct data transfers.
- **Broadcast Asymmetry**: Broadcast (dst) grows significantly in lower-numbered devices (Device 3 doubles Device 0's allocation).
- **Reload weights Consistency**: Reload weights decrease uniformly, possibly indicating prioritized resource allocation for critical operations.
- **Buffer Separation**: H2D and IPC buffers are isolated from data flow segments, emphasizing their role as storage layers.
### Interpretation
The diagram reveals a hierarchical data distribution strategy:
- **Device 0** acts as a primary data processor, with heavy H2D usage and moderate Broadcast (src).
- **Device 3** shifts focus toward Broadcast (dst), implying it may handle downstream data aggregation or redistribution.
- **Reload weights** decrease systematically, potentially reflecting diminishing returns in weight updates or prioritization of stable operations.
- The IPC Buffer's uniform size suggests a fixed overhead for inter-process communication across all devices.
This pattern aligns with systems where Device 0 serves as a central node, while lower-numbered devices specialize in data redistribution. The reload weights' decline might indicate adaptive resource management to balance computational load.