## Chart: Test Loss vs. Parameters
### Overview
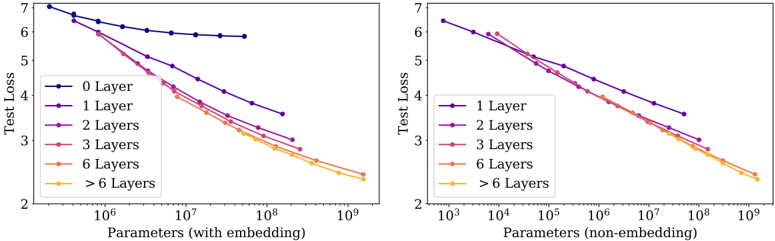
The image presents two line charts comparing the test loss of models with varying numbers of layers against the number of parameters. The left chart shows the relationship when parameters include embeddings, while the right chart excludes embeddings. The number of layers is represented by different colored lines.
### Components/Axes
**Left Chart:**
* **Title:** Parameters (with embedding)
* **X-axis:** Parameters (with embedding), logarithmic scale from 10^6 to 10^9
* **Y-axis:** Test Loss, linear scale from 2 to 7
* **Legend (top-left):**
* Dark Blue: 0 Layer
* Purple: 1 Layer
* Medium Purple: 2 Layers
* Pink: 3 Layers
* Light Orange: 6 Layers
* Orange: > 6 Layers
**Right Chart:**
* **Title:** Parameters (non-embedding)
* **X-axis:** Parameters (non-embedding), logarithmic scale from 10^3 to 10^9
* **Y-axis:** Test Loss, linear scale from 2 to 7
* **Legend (left):**
* Purple: 1 Layer
* Medium Purple: 2 Layers
* Pink: 3 Layers
* Light Orange: 6 Layers
* Orange: > 6 Layers
### Detailed Analysis
**Left Chart (with embedding):**
* **0 Layer (Dark Blue):** Starts at approximately 6.8 test loss at 10^6 parameters, remains relatively flat around 6.0 test loss until 10^9 parameters.
* **1 Layer (Purple):** Starts at approximately 7.0 test loss at 10^6 parameters, decreases to approximately 3.5 test loss at 10^9 parameters.
* **2 Layers (Medium Purple):** Starts at approximately 6.0 test loss at 10^6 parameters, decreases to approximately 3.0 test loss at 10^9 parameters.
* **3 Layers (Pink):** Starts at approximately 5.0 test loss at 10^6 parameters, decreases to approximately 2.7 test loss at 10^9 parameters.
* **6 Layers (Light Orange):** Starts at approximately 4.5 test loss at 10^6 parameters, decreases to approximately 2.5 test loss at 10^9 parameters.
* **> 6 Layers (Orange):** Starts at approximately 4.0 test loss at 10^6 parameters, decreases to approximately 2.3 test loss at 10^9 parameters.
**Right Chart (non-embedding):**
* **1 Layer (Purple):** Starts at approximately 6.5 test loss at 10^3 parameters, decreases to approximately 4.2 test loss at 10^9 parameters.
* **2 Layers (Medium Purple):** Starts at approximately 6.0 test loss at 10^3 parameters, decreases to approximately 3.5 test loss at 10^9 parameters.
* **3 Layers (Pink):** Starts at approximately 6.0 test loss at 10^3 parameters, decreases to approximately 3.0 test loss at 10^9 parameters.
* **6 Layers (Light Orange):** Starts at approximately 5.5 test loss at 10^3 parameters, decreases to approximately 2.5 test loss at 10^9 parameters.
* **> 6 Layers (Orange):** Starts at approximately 5.0 test loss at 10^3 parameters, decreases to approximately 2.3 test loss at 10^9 parameters.
### Key Observations
* In both charts, increasing the number of parameters generally leads to a decrease in test loss.
* The "0 Layer" model in the left chart (with embedding) shows minimal improvement in test loss as the number of parameters increases.
* The right chart (non-embedding) shows a steeper initial decrease in test loss for all models as the number of parameters increases from 10^3 to 10^6, compared to the left chart.
* The models with more layers (6 and >6) consistently achieve lower test loss compared to models with fewer layers (1, 2, and 3) in both charts.
### Interpretation
The charts suggest that increasing the number of layers and parameters in a model generally improves its performance, as indicated by the decrease in test loss. The inclusion of embeddings appears to shift the parameter scale, requiring more parameters to achieve similar test loss reductions compared to models without embeddings. The "0 Layer" model's flat performance in the left chart indicates that simply increasing parameters without adding layers does not significantly improve performance. The steeper initial decrease in test loss in the right chart suggests that the initial impact of increasing parameters is more pronounced when embeddings are not included. The models with more layers consistently outperform those with fewer layers, highlighting the importance of model depth in achieving better results.